

Website redesign ROI: how to validate it before you build




Website redesign ROI: how to validate it before you build
No time to read? Explore through headphones, speakers, or on the go.
TL;DR
Short on time before the budget meeting? Here’s how we validate redesign ROI before starting the process itself:
- Borrowed ROI stats won’t survive a CFO. Build the number from your own funnel data.
- Work out the uplift the redesign needs to break even, then test whether that target is realistic.
- Validate with low-cost tests, a pilot page above all, before you fund the full build.
- Agree on ROI vs ROMI, the risks, and success criteria with finance before launch.
- If the numbers say “not yet”, rebuild the pages closest to revenue first.


Every website redesign reaches the same meeting. The CFO, or a CEO thinking like one, asks a single question: what do we get back for this money?
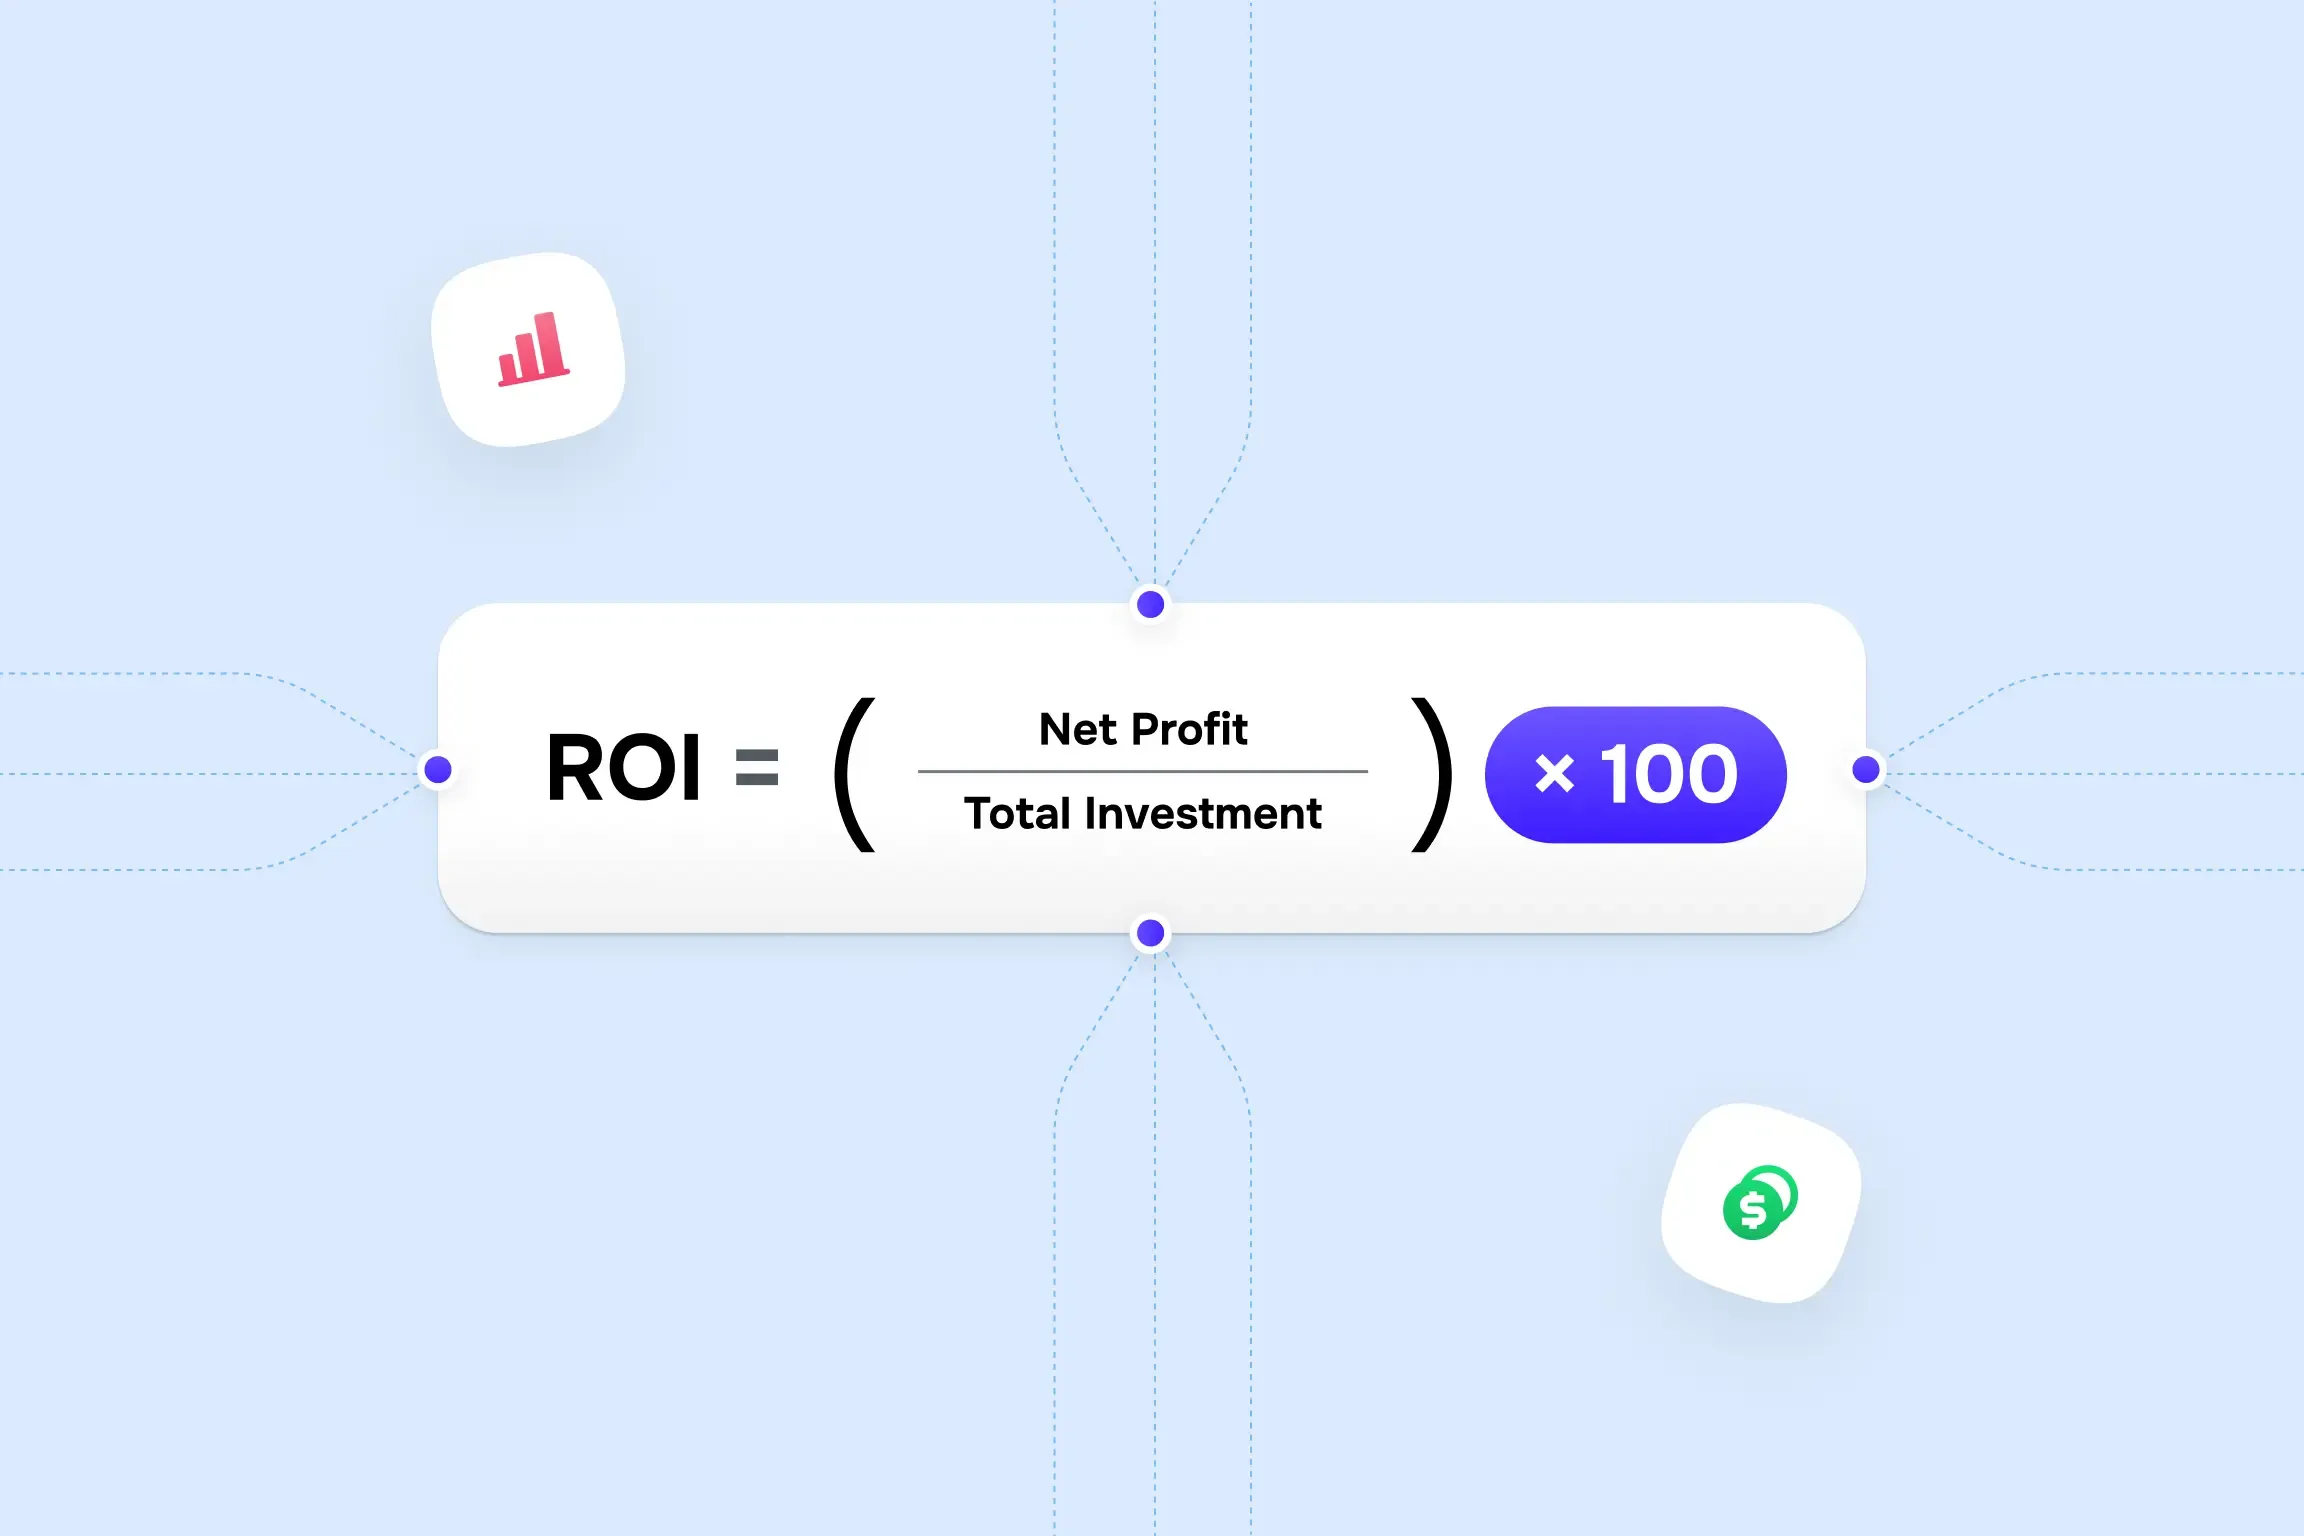
Most teams answer with borrowed numbers. The best-known says every $1 invested in UX returns $100, a 9,900% ROI. Most retellings point to Forrester’s report The Six Steps For Justifying Better UX, which sits behind a $1,495 paywall. Its public summary doesn’t mention the figure at all. Others attribute the claim to Roger Pressman’s textbook Software Engineering: A Practitioner’s Approach, quoting a range of $2 to $100, and some retellings can’t even agree on the percentage.
We can say it tells you nothing about your website, your funnel, or your sales cycle. A finance lead who spots that will discount the rest of your business case along with it.
The stronger answer is a number you build yourself.
Where a redesign's return comes from
A redesign earns its money through four levers. Most business cases lean on the first and ignore the rest.
- Conversion rate. Clearer messaging, shorter forms, and stronger proof turn more existing visitors into leads.
- Lead quality. Sharper positioning filters out poor-fit prospects, so more leads become SQLs and sales spends less time on the wrong calls.
- Deal size. A site that matches the maturity of your product can support up-market positioning and higher contract values.
- Search and speed. Fixing technical SEO, page speed, and mobile performance grows organic traffic, though the effect is slow and hard to isolate.
Treat published benchmarks for these levers with care. Agency and tool blogs regularly cite conversion lifts of 20–50% after a redesign, and the ones we reviewed named no study behind the figure. Payback claims vary even more.
One Shopify-focused calculator promises break-even in two to six months, while a B2B agency guide calls 12 to 18 months the standard and gives 4 to 14 months in its own FAQ.
Each number reflects a different business, sales cycle, and starting point. None reflects yours, so the steps below build the estimate from your own data.
Want a website that pays off?
Redesign your site with Goodface — let's discuss the details.

Why redesign business cases fall apart
Most redesign business cases fail before launch, in the spreadsheet. Four gaps show up again and again.
- No baseline. If nobody recorded how the current site performs, "after" has nothing to compare against. Every result becomes a matter of opinion.
- The wrong metrics. Traffic, time on page, and bounce rate are easy to report and hard to tie to revenue. A site can gain 40% more sessions and produce the same number of qualified leads.
- Ignored sales lag. In B2B tech, a lead that arrives in month two may close in month eight. Judge the redesign at month three, and it looks like a failure, even when the pipeline is filling.
- A symptom framed as the problem. "Our site looks outdated" is a description of how the site feels. It doesn't name what the site costs you. Until you can state that cost, you can't estimate what fixing it is worth.
Step 1: Name the business problem the site causes
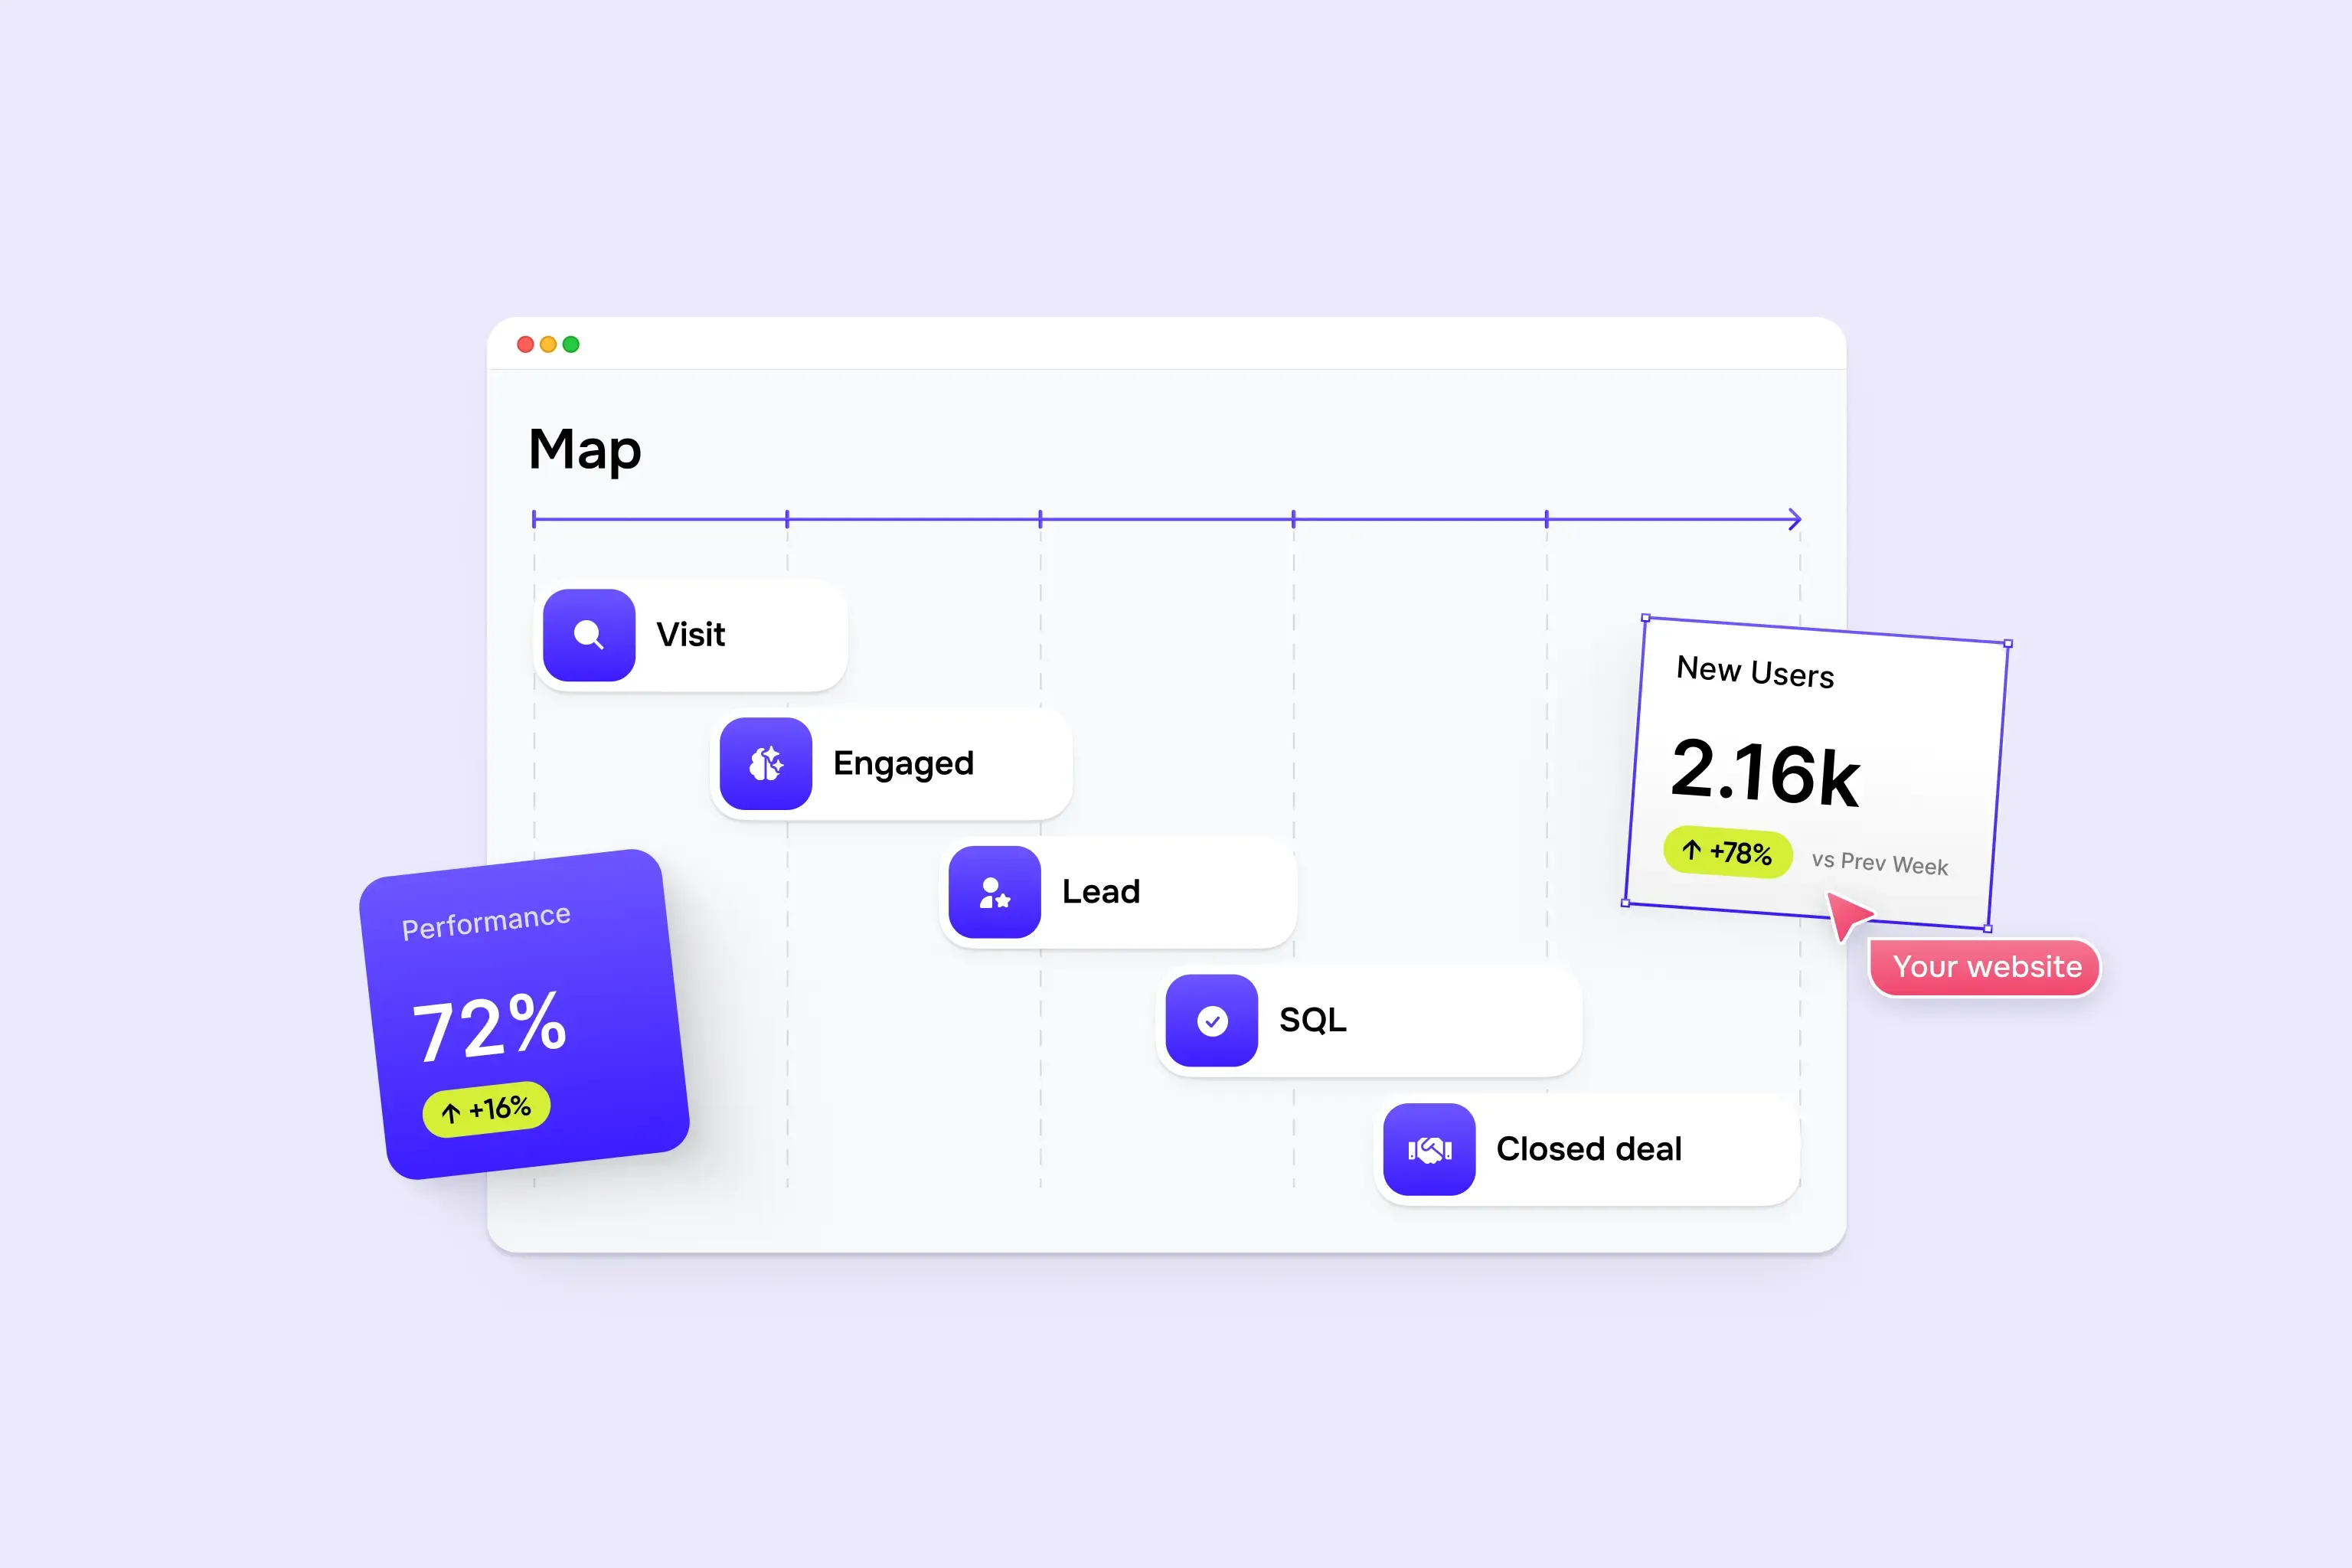
Map out the path a buyer takes through your site and into sales: visit, engaged visit, lead, sales-qualified lead (SQL), closed deal. Then find the stage where the drop-off is worse than it should be.
The evidence usually sits in four places:
- Analytics. High-intent pages (pricing, demo request, integrations, security or compliance) that get traffic but few conversions.
- CRM data. Website-sourced leads that rarely become SQLs, which points to the site attracting the wrong segment or setting the wrong expectations.
- Sales calls. If reps spend the first 15 minutes of every call explaining what your product does, the site isn't doing that job. Ask sales to keep a two-week log of questions prospects ask that the site should have answered.
- Lost-deal notes. Buyers who chose a competitor often mention that the other vendor "looked more established" or explained the product more clearly. That's a trust gap with a cost attached.
Turn what you find into one sentence: our site does X, and it costs us Y at stage Z. For example: "Our product pages don't explain the API, so developer-led prospects leave before requesting a demo, and demo requests from that segment are half what sales expects."
Every step that follows tests whether fixing it is worth the money.
Step 2: Lock a baseline and audit your tracking first
Before you model any return, record how the current site performs at every stage you mapped in Step 1. Pick a window that covers at least one full sales cycle, and check it against seasonality. A baseline built on the weeks around a major conference or a funding announcement will flatter or punish whatever comes next.
Then audit the tracking itself. This step costs little and often changes the whole business case. Check that:
- form submissions reach your CRM with their source and landing page attached;
- demo bookings made through a scheduling tool are counted as conversions, not lost between systems;
- key events (pricing page views, calculator use, doc downloads) fire correctly on every template;
- you know how much of your traffic declines cookie consent, since under UK and EU rules that share won't appear in your analytics at all.
If website-sourced pipeline can't be traced today, no redesign result will be provable later.
Step 3: Reverse the ROI question
Forecasting the uplift a redesign will deliver is guesswork. Instead, calculate the uplift it needs to deliver to be more precise.
Start there, and the CFO conversation moves from "will this work?" to "is this target realistic?", which is a question you can test.
First, count the full cost. Agency quotes rarely cover everything, so set out each line:
- design and build fees;
- internal hours from marketing, product marketing, sales, and engineering;
- content writing, photography, and illustration, which are often priced separately;
- legal or compliance review, a real-time cost for FinTech and other regulated products;
- migration, QA, and post-launch fixes;
- the cost of the team not working on something else for those weeks.
Here is a worked example with illustrative numbers. Swap in your own.
Input | Value |
Total cost, including internal time | $90,000 |
Average first-year deal value | $25,000 |
SQL-to-win rate | 20% |
Required extra SQLs | 18 over 12 months (1.5 per month) |
Current website-sourced SQLs | 12 per month |
Required uplift | 12.5% |
A 12.5% lift in website-sourced SQLs is a target your team can argue about with evidence. Two adjustments make it more honest:
- Respect the sales cycle. If deals take six months to close, SQLs created in the second half of year one will close in year two. Either extend the payback window or count only the SQLs that can close within it. Measure payback from the month the first new deals close, not from launch day.
- Agree on the value metric with finance. Some finance teams count first-year revenue, others gross margin or customer lifetime value. Settle this before the meeting, not during it.
ROI or ROMI: know which number you're presenting
ROMI, return on marketing investment, is the ratio most marketing teams use to compare channels. It measures the gross profit an activity generates against the marketing money spent on it:
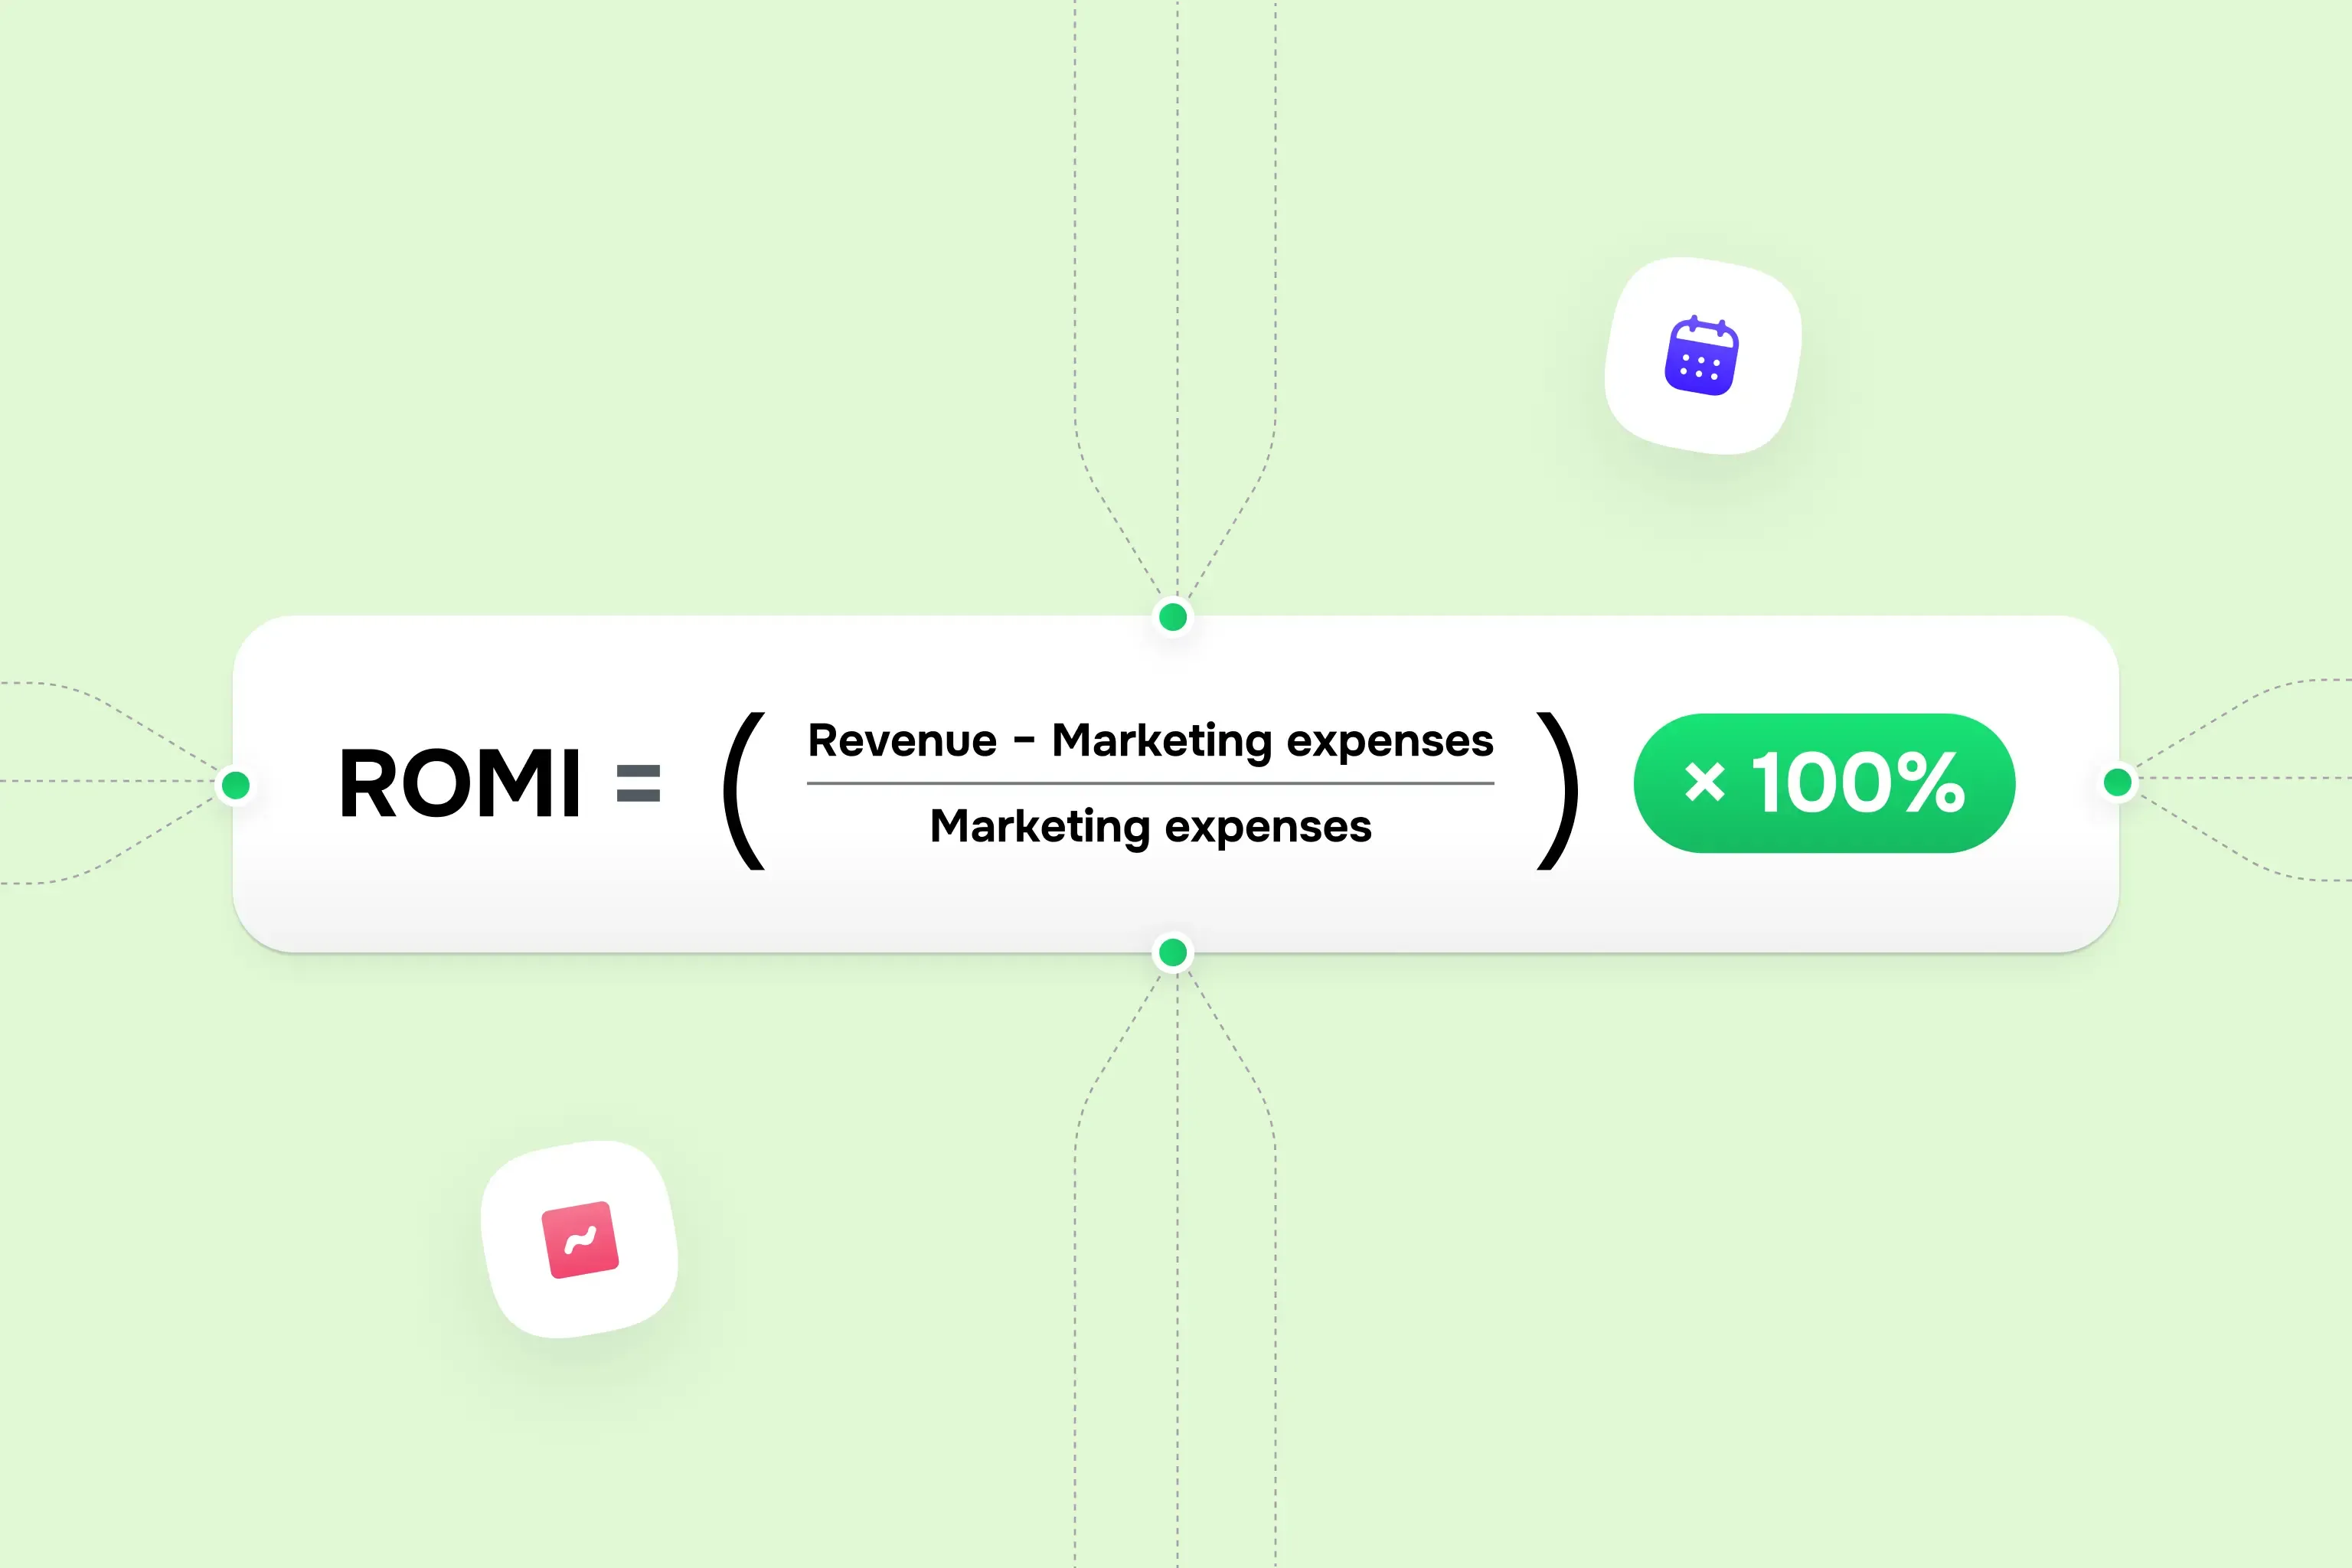
Two differences between ROI and ROMI matter for a redesign — what ROMI counts:
- gross profit rather than revenue, which raises the bar;
- marketing spend and leaves out internal hours from sales, product, and engineering, which lowers it.
Take the example from Step 3 with a 75% gross margin. Covering the full $90,000 cost from gross profit takes about 24 extra SQLs. If $20,000 of that cost is internal time and ROMI counts only the remaining $70,000, break-even drops to about 19 SQLs. Only the project’s target changes here.
A website also outlives a campaign. Paid ads are used up in the month you buy them, while a site keeps working for years.
If you compare the redesign's ROMI with channel ROMI, spread its cost over the period the finance team expects the site to stay in use, and state that assumption. Present ROMI next to full ROI rather than in place of it, so nobody suspects the friendlier number was picked on purpose.
Finally, run three scenarios: conservative, expected, and optimistic. If only the optimistic one breaks even, you have learned something important before spending anything.
Step 4: Validate before you build
Your model now rests on a few assumptions: that the problem from Step 1 is real, that a better site would fix it, and that the fix would move SQLs by the required amount.
Each one can be tested for a small share of the build budget. The tests below run from cheapest to most involved.
Test | What it checks | Typical effort |
Interviews with 5–8 recent wins and losses | Whether the site shaped the buying decision at all | 1–2 weeks |
First-click and five-second tests with ICP-matched participants | Whether visitors understand what you do and where to go next | Days |
Message test: two positioning variants on small paid LinkedIn campaigns | Which story earns more clicks and conversions from the same audience | 2–4 weeks |
Clickable prototype of the critical flow (demo request, pricing, signup) | Whether the proposed fix removes the friction you found | 2–3 weeks |
Pilot page: rebuild one high-intent page on the current site | Whether the fix moves a real conversion metric | 4–8 weeks |
The pilot page carries the most weight. If a rebuilt pricing or demo page lifts its own conversion rate, you have direct evidence for the model. If it doesn't, you've learned that before committing the full budget.
Two cautions keep these tests honest. Small paid campaigns give a directional signal rather than statistical proof, so treat a 2% difference as a tie. And test with people who match your ICP.
Feedback from colleagues or general user panels tells you whether a page is usable rather than whether it persuades a Head of Growth at a 200-person SaaS company.
Website isn't working for you?
Our team rebuilds it to support your business goals.
Step 5: Price the downside
Add the risks, with a cost or a mitigation next to each.
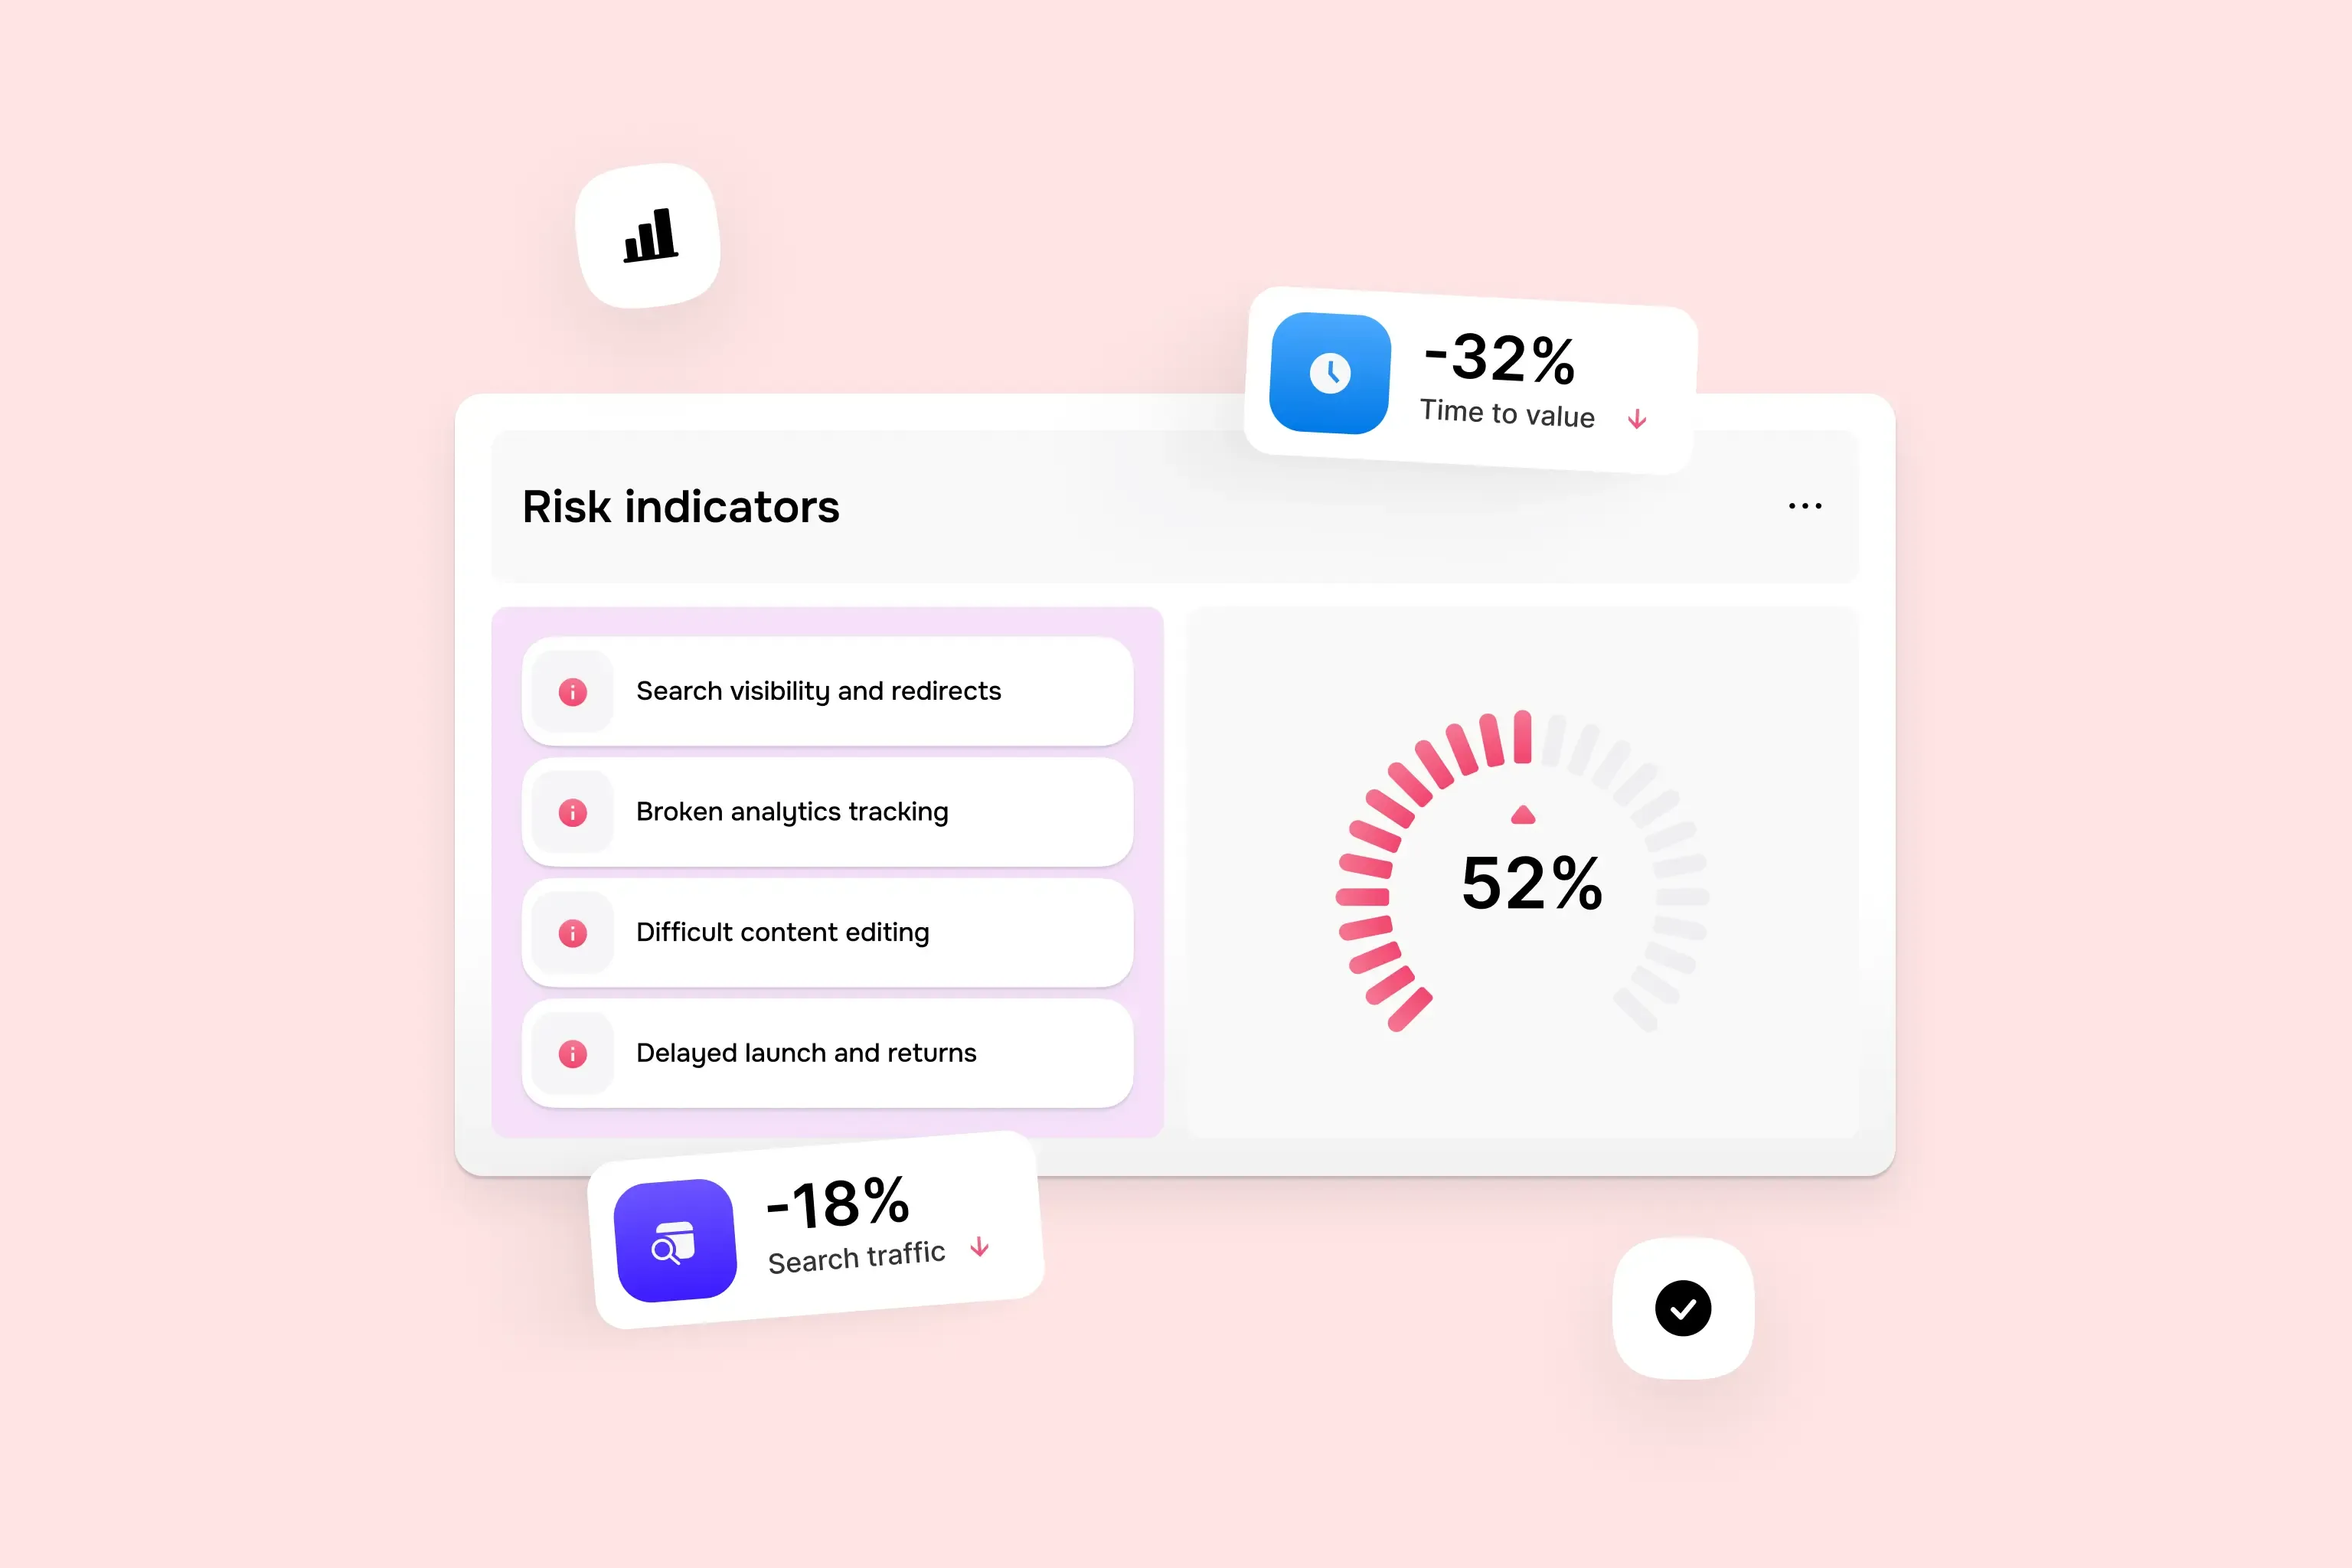
- Search traffic during migration. Changing URLs means Google has to recrawl and reprocess your pages. Google's own site move guidance tells site owners to expect temporary ranking fluctuation during a move. Map every old URL to its new one, set up 301 redirects, and estimate what a few weeks of lower organic leads would cost. If organic search drives a large share of your pipeline, this line belongs in the model.
- Tracking gaps at launch. New templates break event tracking more often than teams expect. Test every conversion event on staging, and plan for a short period of incomplete data in your results.
- Editability after launch. A site that only developers can update loses value with every campaign marketing can't ship. Ask how your team will build a new landing page in month four, and who will do it.
- Time to value. Each month the build runs is a month the current site keeps leaking pipeline. A phased launch, where the highest-intent pages go live first, starts the return sooner and reduces risk.
All of the risks above set a realistic floor for what it has to beat.
Step 6: Define what success means, and when you'll know
Write down the success criteria before launch, and get finance to sign off on them. Criteria set after launch tend to drift toward whatever the numbers happen to show.
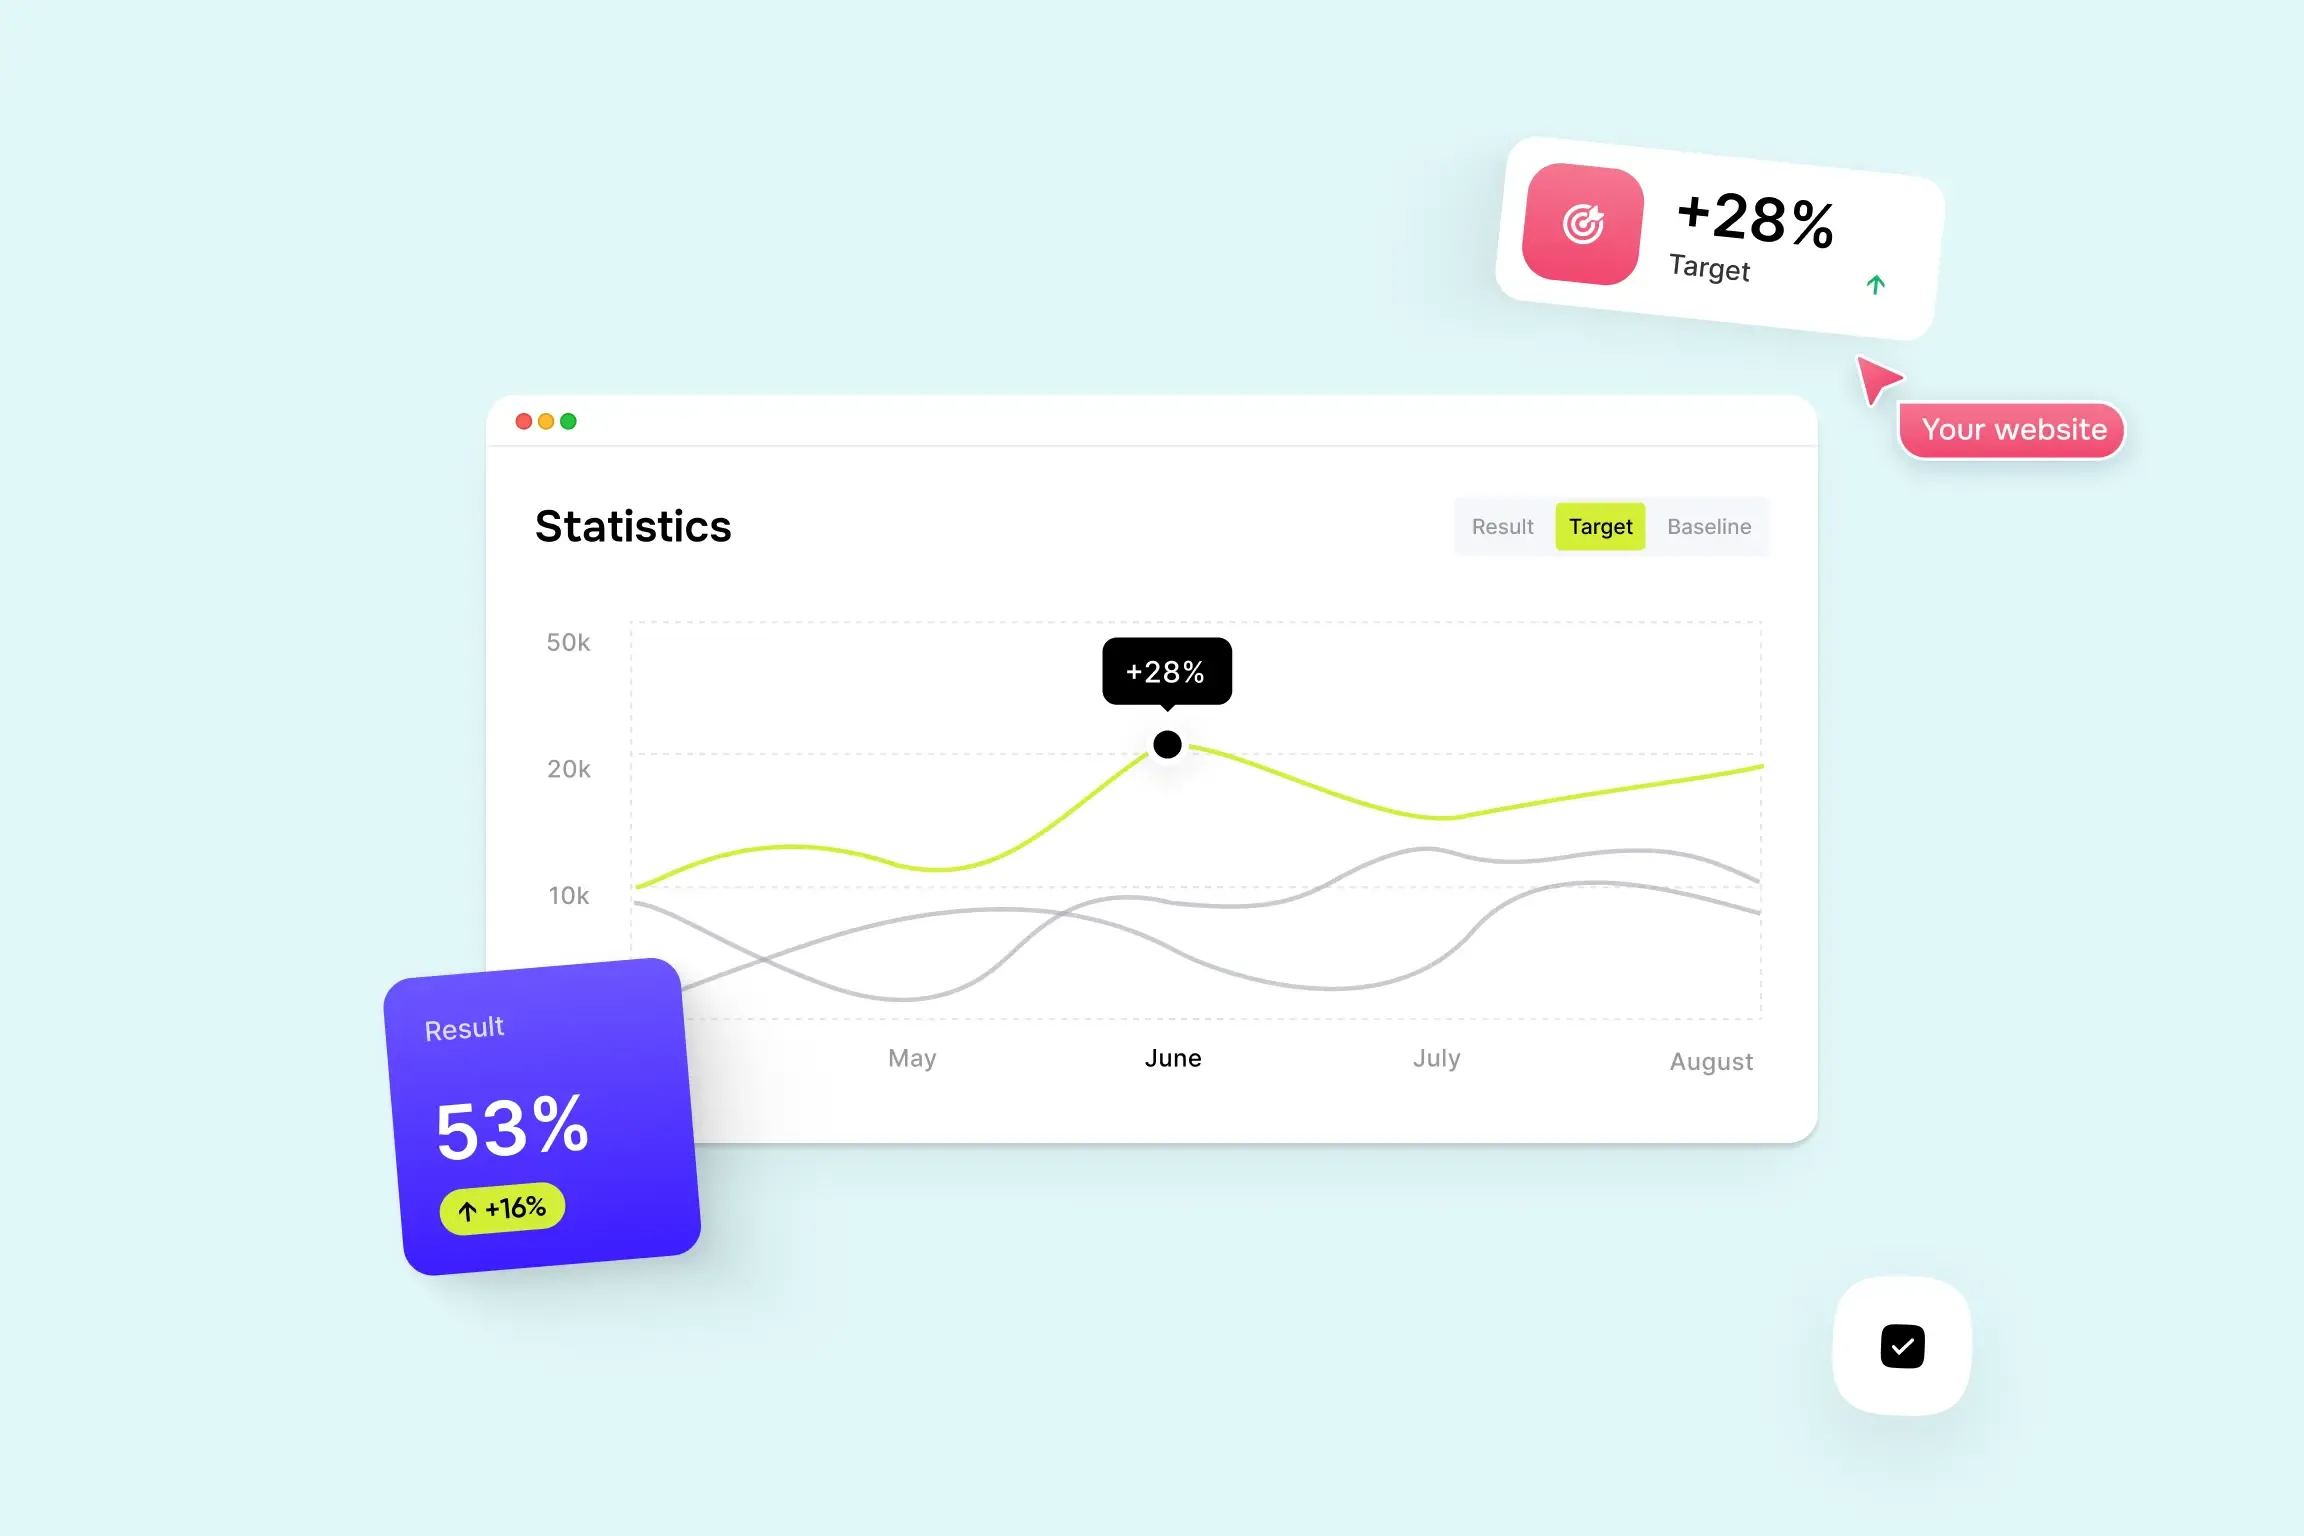
Split the metrics by how fast they move. Leading indicators show early whether the redesign is on track. Lagging indicators prove the return, but only after a full sales cycle.
| Metric | Type | When to judge it |
| Conversion rate on high-intent pages | Leading | 4–8 weeks after launch |
| Demo or contact requests from target segments | Leading | 4–8 weeks after launch |
| Lead-to-SQL rate for website-sourced leads | Leading | One to two months after launch |
| Website-sourced pipeline value | Lagging | After one full sales cycle |
| Closed revenue against the break-even target | Lagging | At the end of the payback window |
For each metric, record the baseline from Step 2, the target from Step 3, and one owner. If leading indicators miss their targets at the first checkpoint, you still have time to iterate on the pages before the lagging numbers arrive.
Some returns won't appear in pipeline reports, yet a CEO will still weigh them. Sales may start sending the site to prospects in place of a PDF deck. Candidates may mention it in interviews. Investors and partners read a company's maturity partly from its website.
Track simple proxies, such as how often sales shares key pages and how long marketing needs to launch a new page, and report them next to the revenue numbers as supporting evidence.
When validation says, "don't redesign yet"
Sometimes the numbers say no, and that's quite a useful result. Three signals point that way:
- the required uplift is far above anything your tests or past data support;
- the leak sits outside the website, in pricing, product fit, or the sales process;
- the pilot page didn't move its own conversion rate.
In those cases, a smaller move often captures most of the value at a fraction of the cost. Fix attribution so you can measure what you already have. Rewrite positioning and copy on the existing pages. Rebuild the three to five pages closest to revenue, usually pricing, demo, and core product pages. Or address page speed and mobile performance, which affect every visit regardless of design.
Each of these also sharpens your data. If you return to a full redesign in six months, you'll do it with a stronger baseline and a business case that holds up.
The pre-build checklist
Before you approve a redesign budget, check that you can answer yes to each of these:
- We can state the problem as "our site does X, and it costs us Y at stage Z."
- We have a baseline covering at least one full sales cycle.
- Website-sourced leads reach our CRM with their source attached.
- We know the full cost, including internal time and content.
- We know the uplift needed to break even, and finance agrees on the value metric.
- At least one test supports the claim that a better site would close the gap.
- SEO migration, tracking, and editability risks have a plan and an owner.
- Success criteria, checkpoints, and owners are written down before launch.
If any answer is no, that item is your next step, and it will cost far less than the build.
Summing up
The most valuable part of a redesign business case often shows up before anyone approves it. Getting marketing, sales, and finance to agree on what the website should earn settles arguments that would otherwise surface mid-project, when every change costs the most.
The model also makes a sharper design brief. Once the team knows which stage of the funnel the site has to fix, every page and feature has a job to justify, and design debates run on evidence instead of taste.
And the effort pays forward. A CMO who brings finance a case with honest assumptions, and later reports against them, walks into the next budget conversation with credibility already in the bank.
Redesign your website with Goodface
Discuss your project with our team — let's build together.
FAQ
How do you calculate website redesign ROI?
We start with the full cost, including internal hours, content, and migration. Divide it by your average deal value multiplied by your SQL-to-win rate, and you get the number of extra SQLs the redesign needs to break even. Compare that with your current website SQLs, and you have the uplift the new site has to deliver.
How long does a website redesign take to pay back?
In B2B tech, payback follows your sales cycle more than your launch date. If deals take six months to close, the first new revenue lands about six months after the site goes live, so start the payback clock from the first closed deal. Quick-payback promises built on ecommerce data rarely hold for longer B2B cycles.
What’s the difference between ROI and ROMI for a redesign?
- ROI sets net return against the full investment, internal time included.
- ROMI sets gross profit against marketing spend only, so it usually looks stronger.
We recommend presenting both side by side and agreeing with finance in advance on which one drives the decision.
Which metrics should we track after launch?
Track leading indicators first: conversion rate on high-intent pages, demo requests from target segments, and the lead-to-SQL rate. They show within weeks whether the site is on track. Website-sourced pipeline and closed revenue prove the return, but only after a full sales cycle.
Will a website redesign hurt our SEO?
It can, for a while. Google’s own guidance warns of temporary ranking swings when URLs change, so map every old URL to its new one, set up 301 redirects, and plan launch timing around your busiest lead periods. Done carefully, a redesign can also fix technical issues that held rankings back.
Read more



Заповніть форму або
бриф із запитаннями



 LinkedIn
 Instagram
Welcome to Goodface privacy notice.
Goodface respects your privacy and is committed to protecting your personal data. This privacy notice will inform you as to how we look after your personal data when you visit our website (regardless of where you visit it from) and other sites we own and operate. And tell you about your privacy rights and how the law protects you.
We may change the privacy policy from time to time to reflect changes to the products and services that we provide and how we process your personal data.
We will not share your information with any third party outside of our organization, other than as necessary to fulfil your request if any."
INFORMATION WE COLLECTWhen you visit our website, our servers may automatically log the standard data provided by your web browser. This data is considered “non-identifying information”, as it does not personally identify you on its own. It may include:
- Your computer’s Internet Protocol (IP) address;
- Your browser type and version;
- The pages you visit;
- The time and date of your visi;
- The time spent on each page;
We may ask for personal information, such as your name and email address. This data is considered “identifying information”, as it can personally identify you. We only request personal information relevant to providing you with a service, and only use it to help provide or improve this service.
We collect information by fair and lawful means, with your knowledge and consent. We also let you know why we’re collecting it and how it will be used. You are free to refuse our request for this information, with the understanding that we may be unable to provide you with some of your desired services without it.
We will only process personal data and communicate with you if:
1. You have given us consent to the processing of your personal data and communicating for one or more specific purposes i.e. requesting products or services from us, downloading material or information from our website or submitting a contact us form.
2. Performance of a contract
3. Where we have a legitimate interest for contacting you in relation to our products and services
DATA PROCESSING AND STORAGEWe only retain personal information for as long as necessary to provide a service, or to improve our services in future. While we retain this data, we will protect it within commercially acceptable means to prevent loss and theft, as well as unauthorised access, disclosure, copying, use or modification. That said, we advise that no method of electronic transmission or storage is 100% secure, and cannot guarantee absolute data security.
Rights and choices of individuals:
- See what data we have about you, if any;
- Change/correct any data we have about you;
- Have us delete any data we have about you;
- See what security measures we apply to your data;
- Express any concern you have about our use of your data;
You may opt out of any future contacts from us at any time. You can do the following at any time by contacting us via the email address given on our website: goodface.agency
Лишились питання або хочете обговорити проєкт?


