Custom SaaS dashboard design in 2026: best practises, UX/UI patterns & real case studies

Updated at
30.06.2026
TL;DR: A SaaS dashboard is only as good as the decisions behind it. Define what action it should drive, map it to the right user roles, and surface only the metrics that trigger a response. From there, hierarchy and visual clarity do the heavy lifting. The teams that get it right ask the right questions before opening Figma.
SaaS dashboard design best practises | 1:32 min
No time to read? Listen via headphones, speakers or on the go
Dashboards succeed when users don't have to think twice
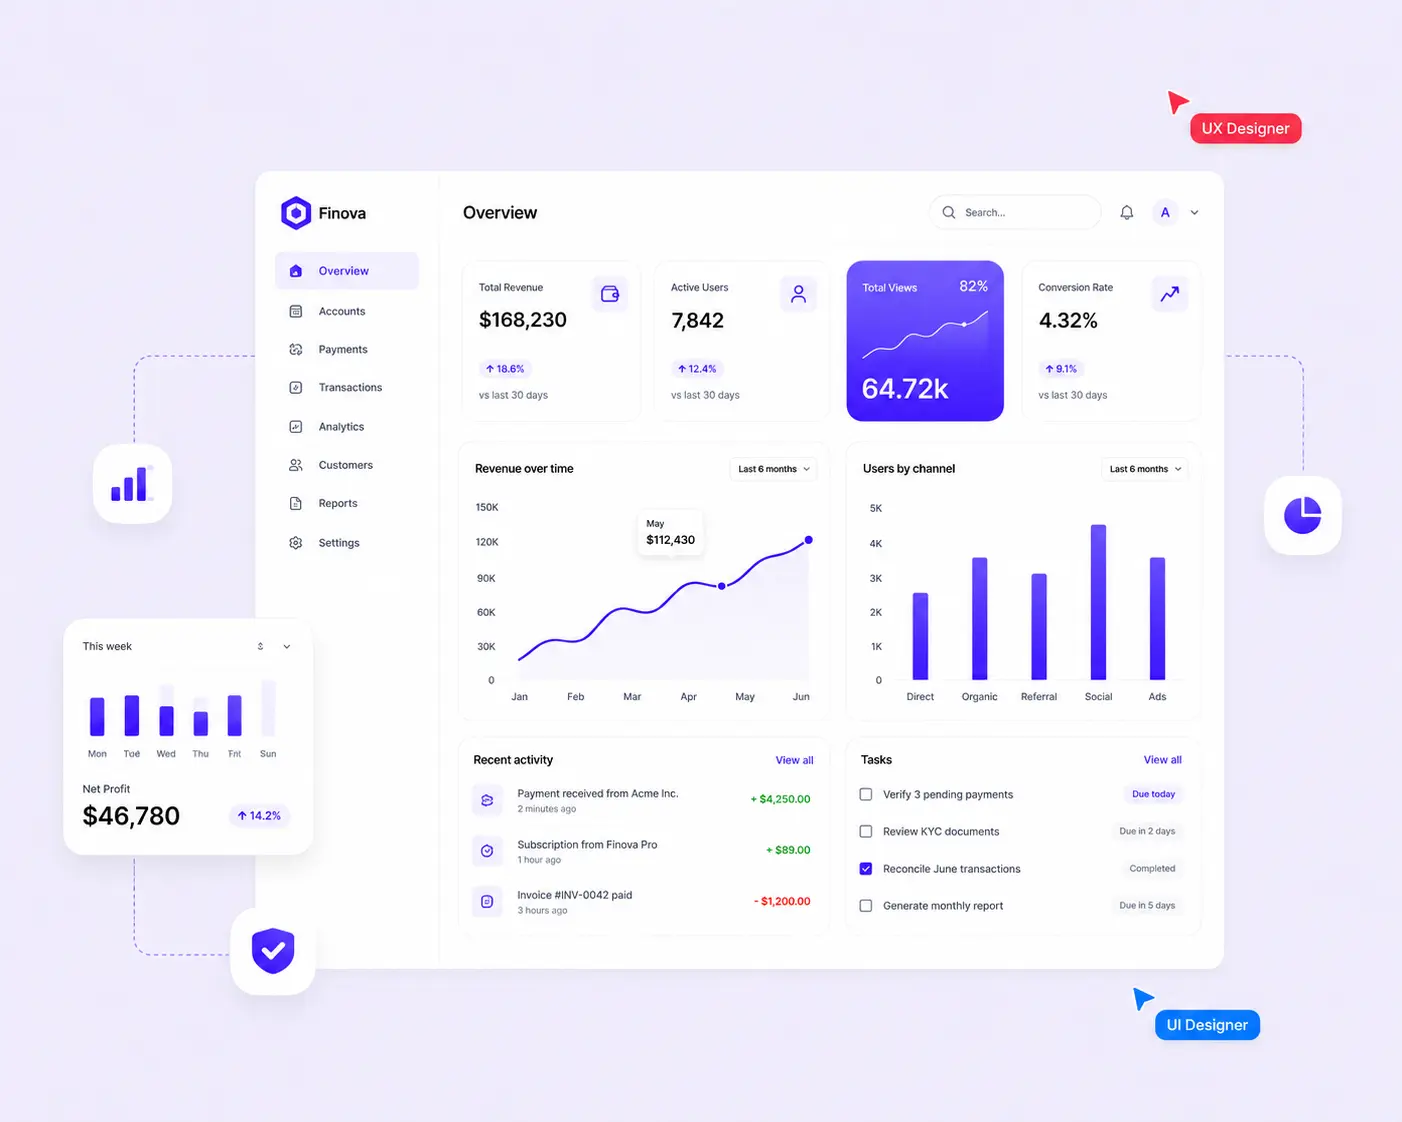
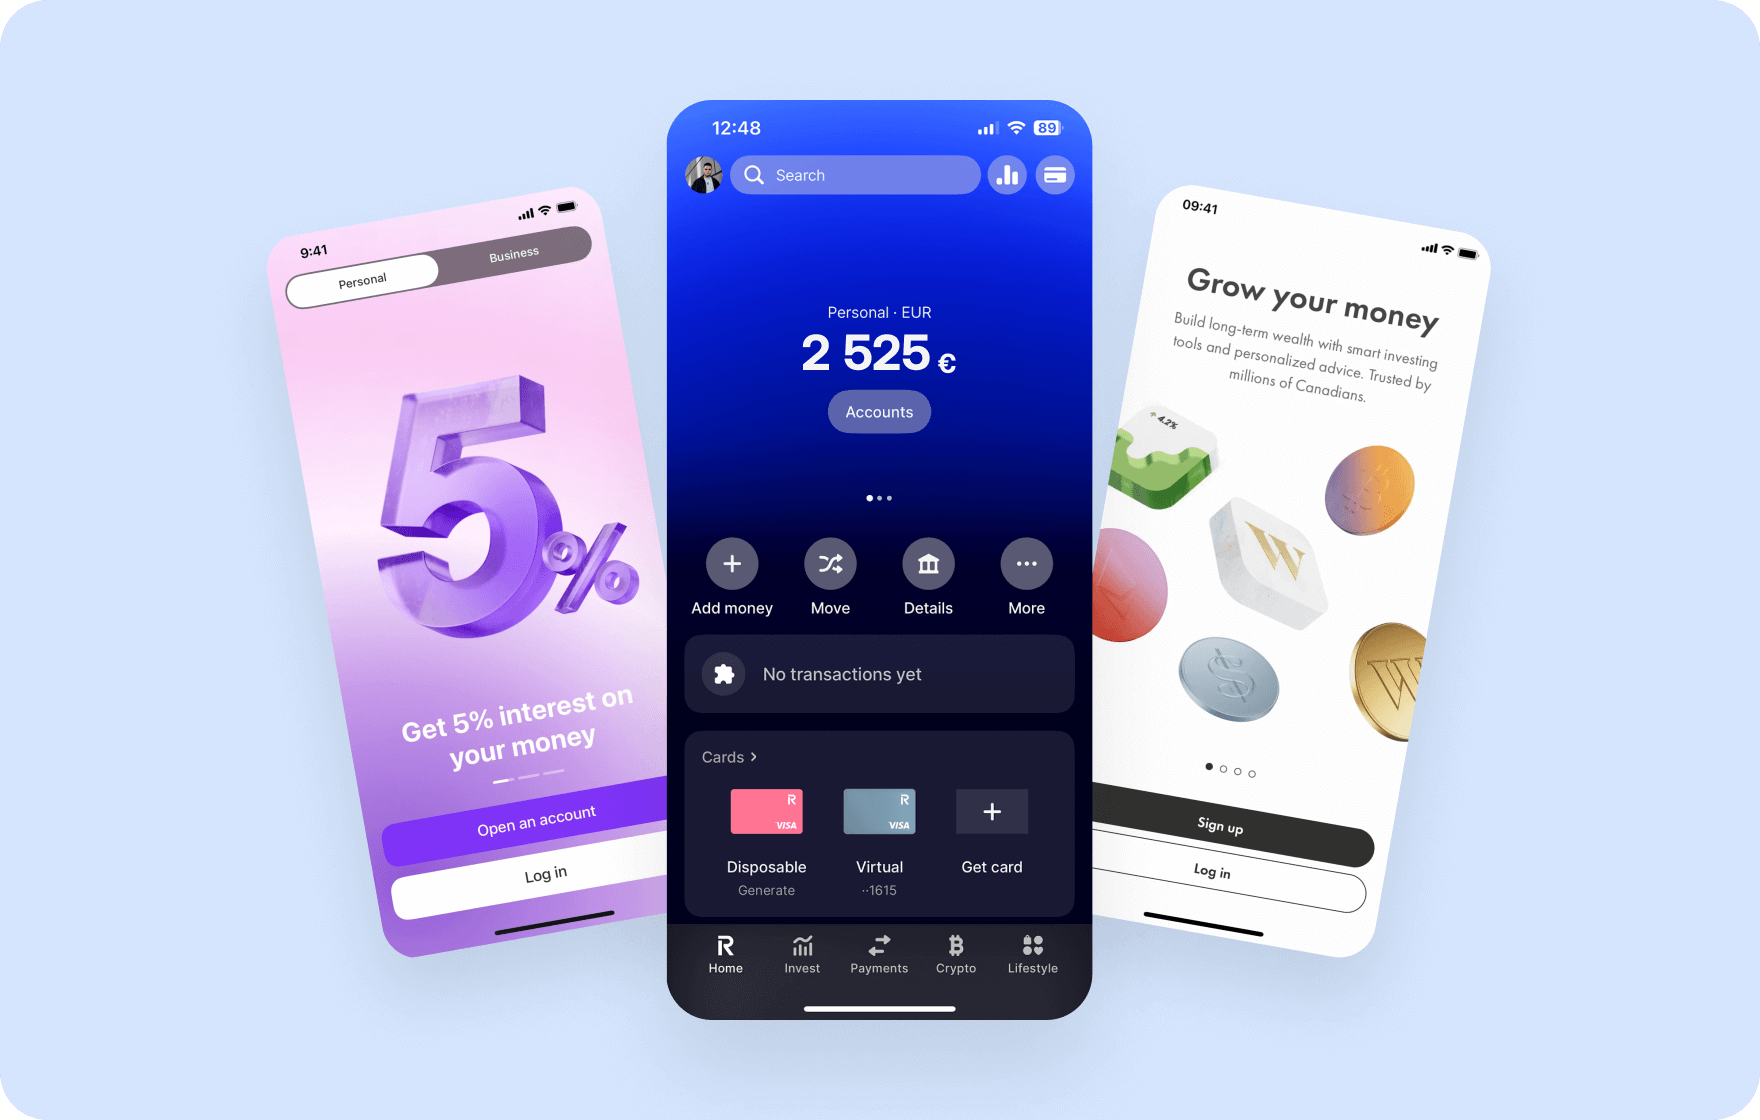
The dashboard is the first screen users see when they log in — and the first place they decide whether the product is worth their time.
Most dashboards are designed for completeness: to show everything and let users find what they need. That logic consistently produces screens nobody uses. A dashboard is a decision surface. Users arrive with a question, and the interface either answers it in seconds or loses them to a spreadsheet they'll build themselves.
At Goodface, we've shipped dashboards for fintech, edTech, eSports, and other SaaS platforms. What we see in every project: the first version the team proposes is more complex than what users need. The work is always about cutting toward clarity, not building toward completeness.
8 SaaS dashboard design best practices that we adhere to
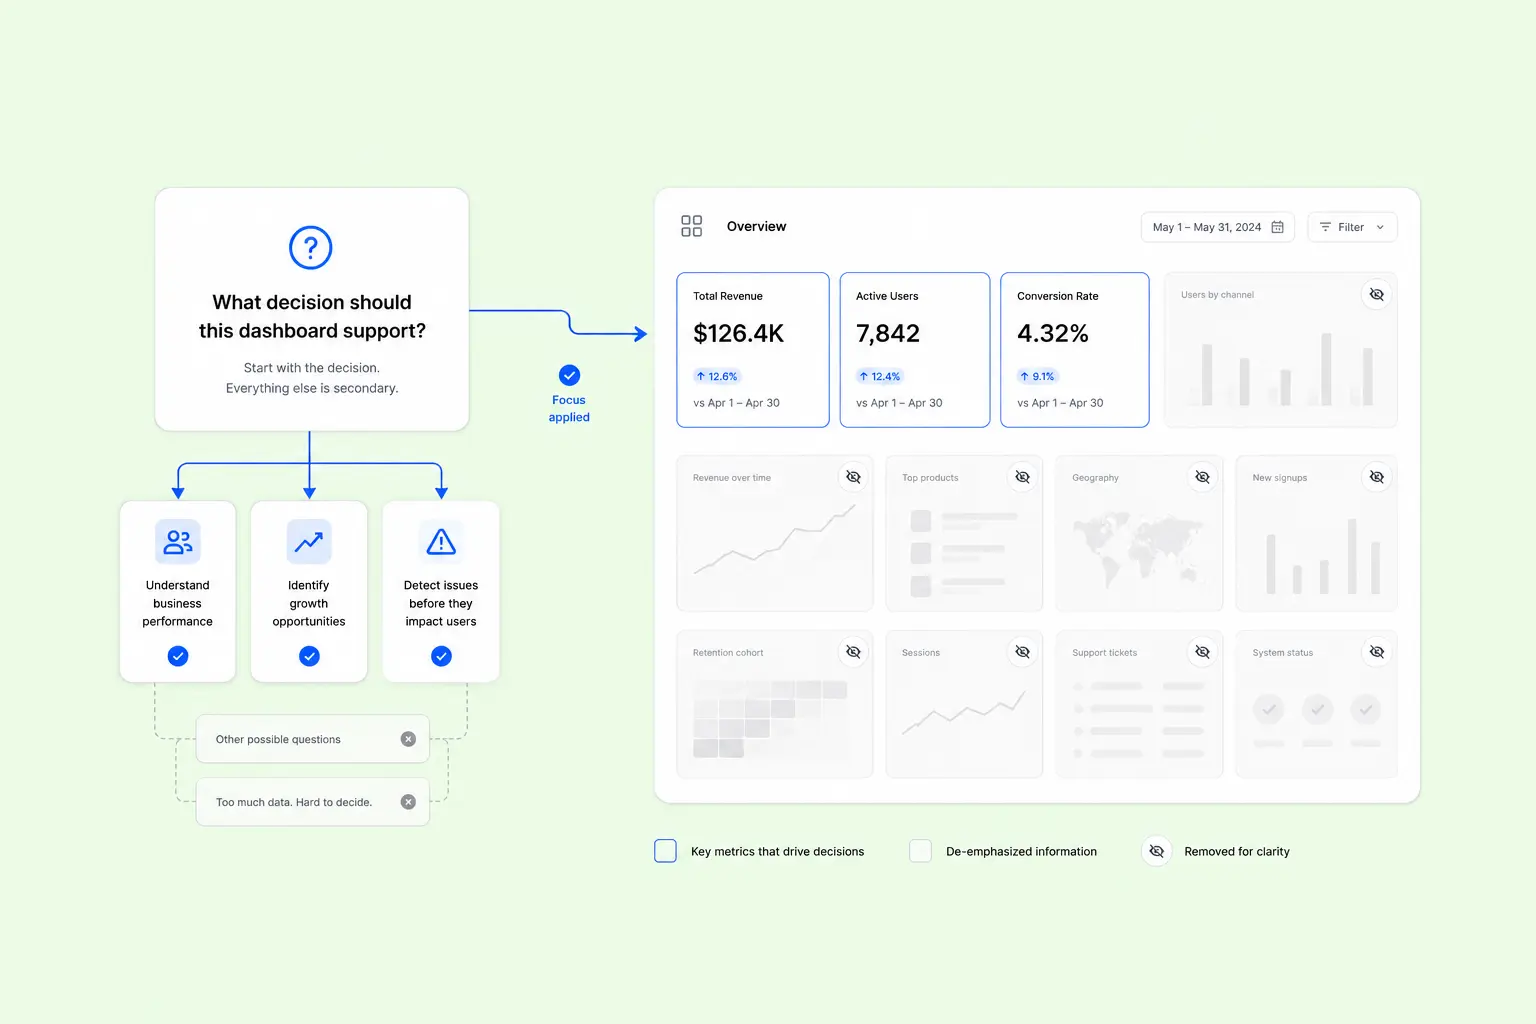
1. Start with the decision, then design the dashboard
Before placing a chart, identify the decision the dashboard should help users make. That answer determines which metrics deserve immediate attention, which belong one level deeper, and which can be removed altogether.
To find out what’s missing, ask users what they currently compile manually outside the product — in spreadsheets, Slack threads, or email. That workaround is almost always the gap that the dashboard isn't filling.
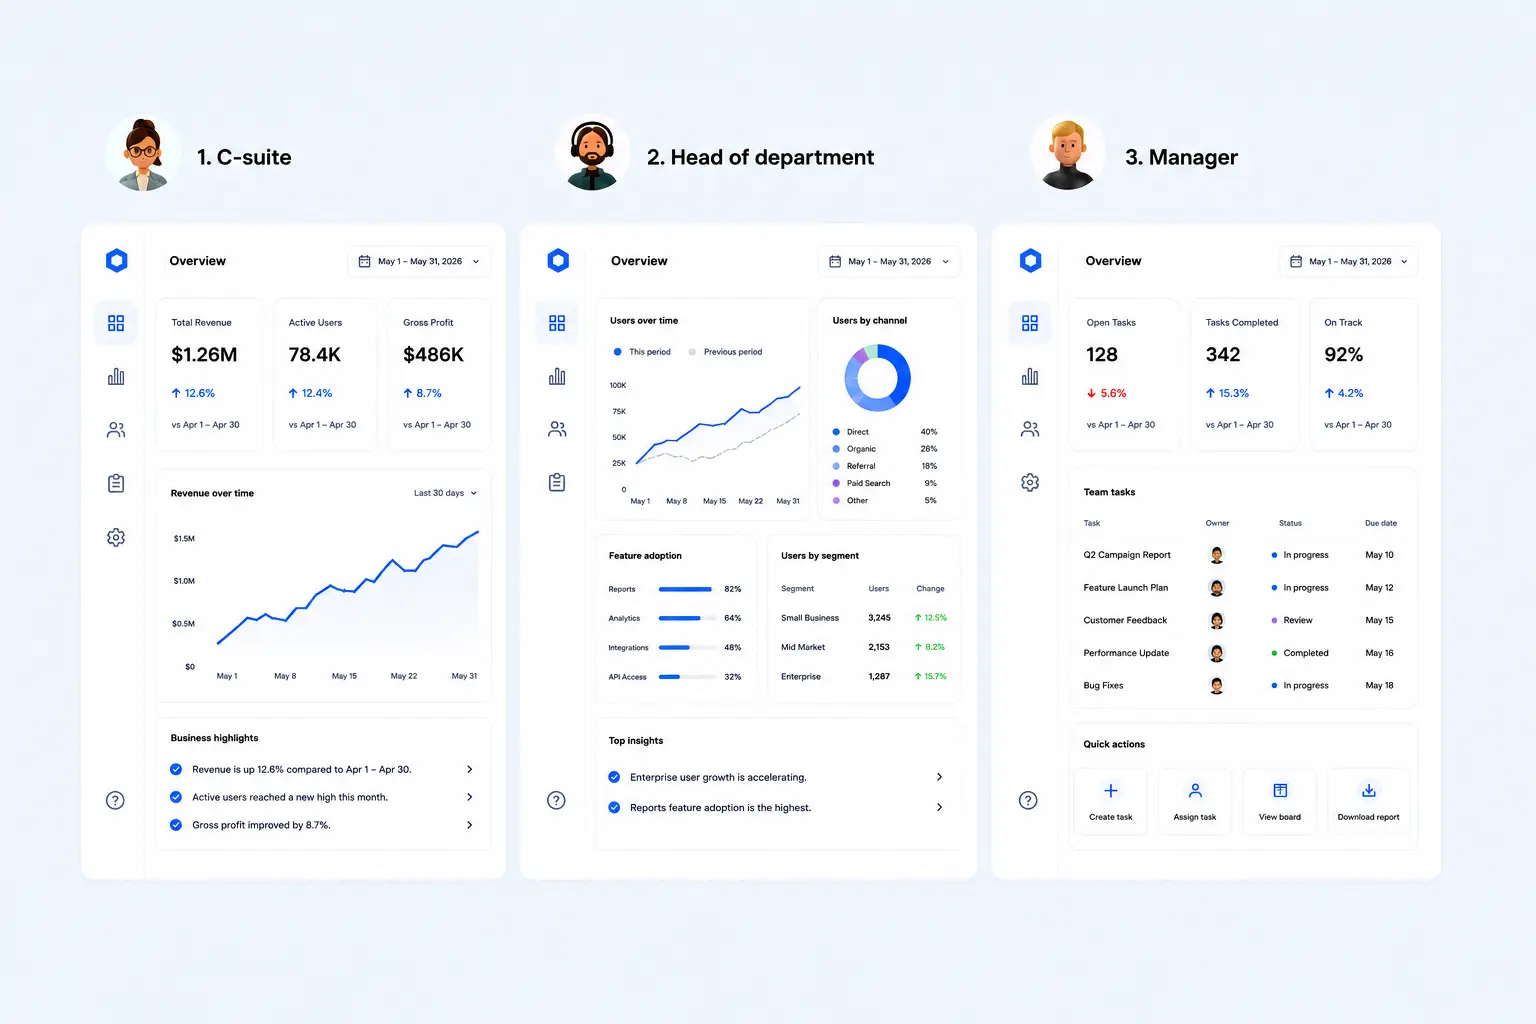
2. Different job roles answer different questions
A CEO, a product owner, or a manager looking at the same data through completely different lenses. Trying to satisfy all three in a single dashboard usually creates unnecessary complexity.
- Executives need a snapshot — a few high-level KPIs, trend direction, and anomalies worth attention.
- Product owners need performance context — progress toward goals, segment breakdowns, period-over-period comparisons.
- Managers need real-time visibility and quick actions — live data, status indicators, tasks.
In practice, this means designing multiple dashboards rather than one. It feels like more work up front. It's less work than iterating on a cluttered single view for six months.
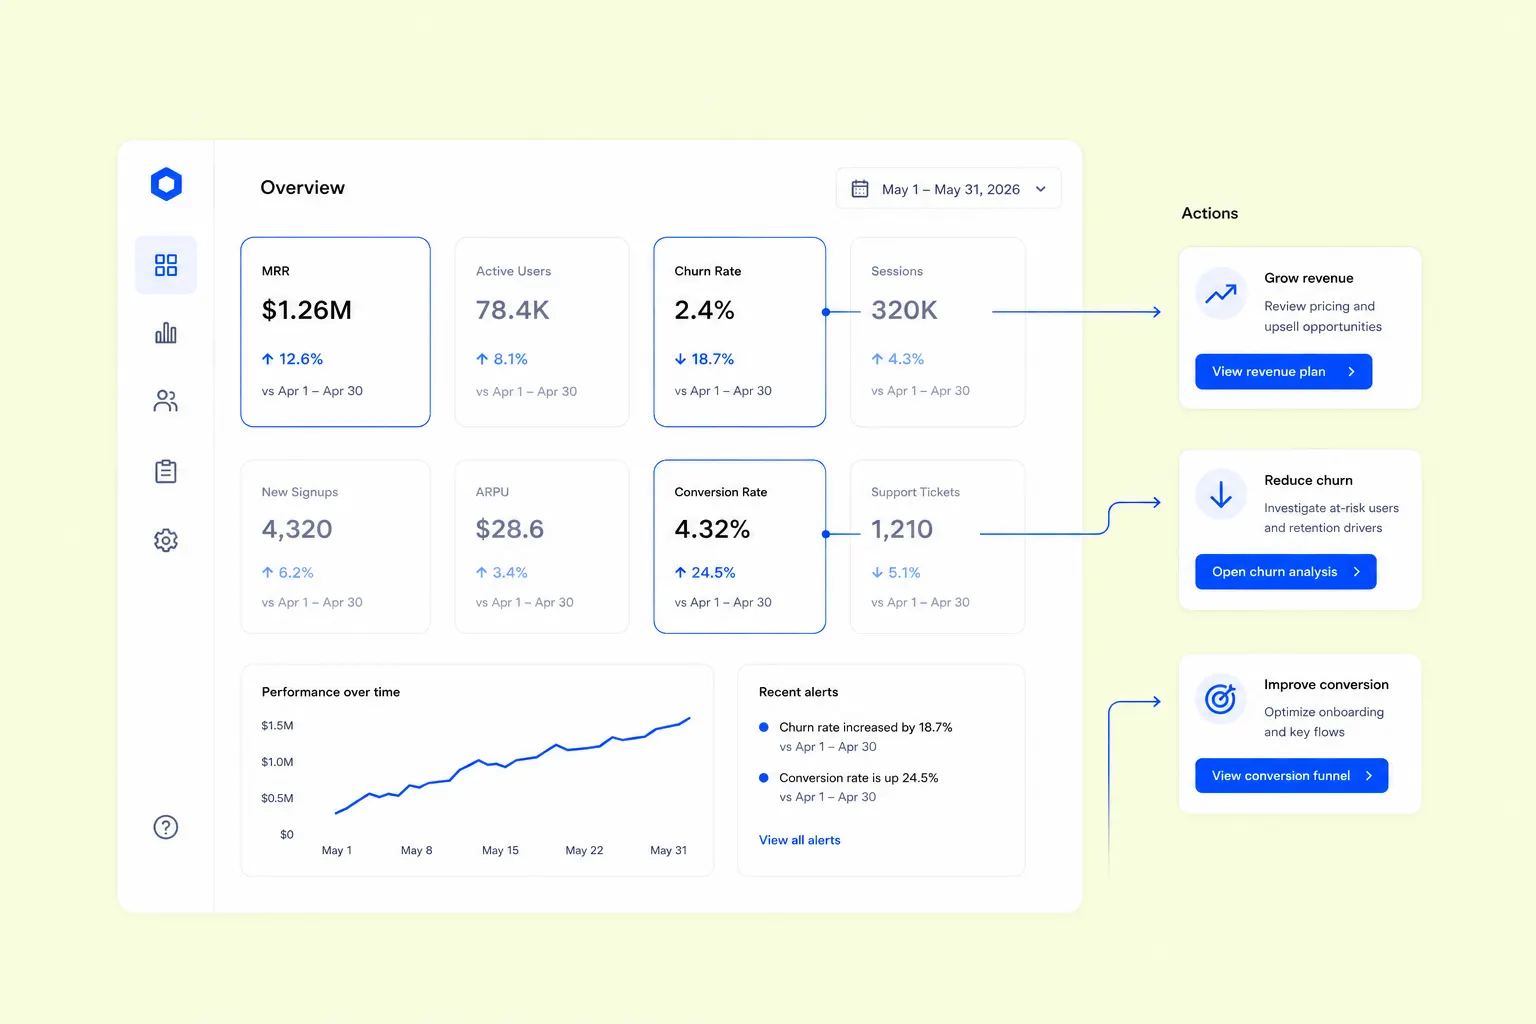
3. Prioritize actionable metrics
Ask one question for every KPI: What changes after someone sees this number? If the answer is unclear, move it lower in the hierarchy or remove it from the initial view.
Instead of general awareness of the situation, a KPI earns its position when a specific value or trend prompts a specific response.
The most challenging part here isn't identifying which metrics pass the test, but getting internal buy-in to deprioritize the ones that feel important but drive nothing.
4. Layout defines priority
Users read hierarchy before labels. Placement, spacing, and size determine what receives attention first, long before someone starts interpreting the data.
We structure layouts around three tiers:
- Primary metrics — 2–4 numbers a user checks first. Large type, with context built in: trend arrows, delta values, period comparisons.
- Secondary context — charts and breakdowns that explain the primary metrics. One visual step below: smaller, quieter, scannable without scrolling.
- Tertiary detail — logs, activity feeds, granular filters. For power users and edge cases, never compete with the core view.
A simple validation exercise — show the dashboard for five seconds, hide it, and ask what people remember. If the answer isn't the primary KPI, the hierarchy isn't strong enough.
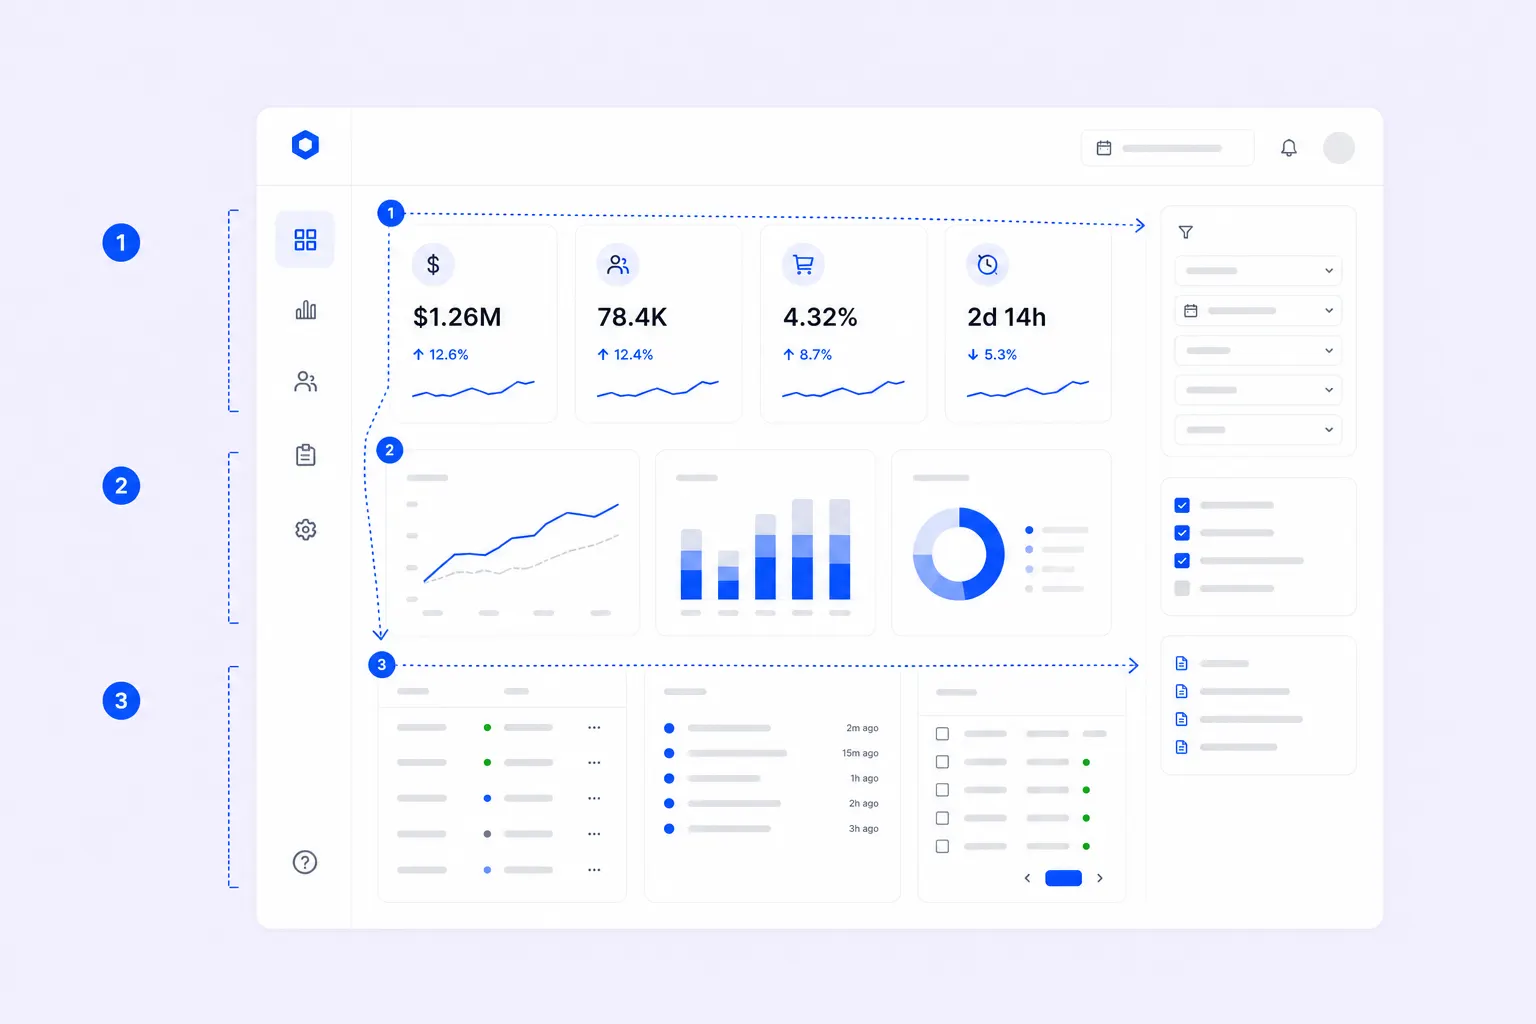
One layout rule we deliberately follow: users scan left to right across the top, then down the left side. Top-left carries the most visual weight. Don't place a logo or navigation label there — that's where the most critical metric lives.
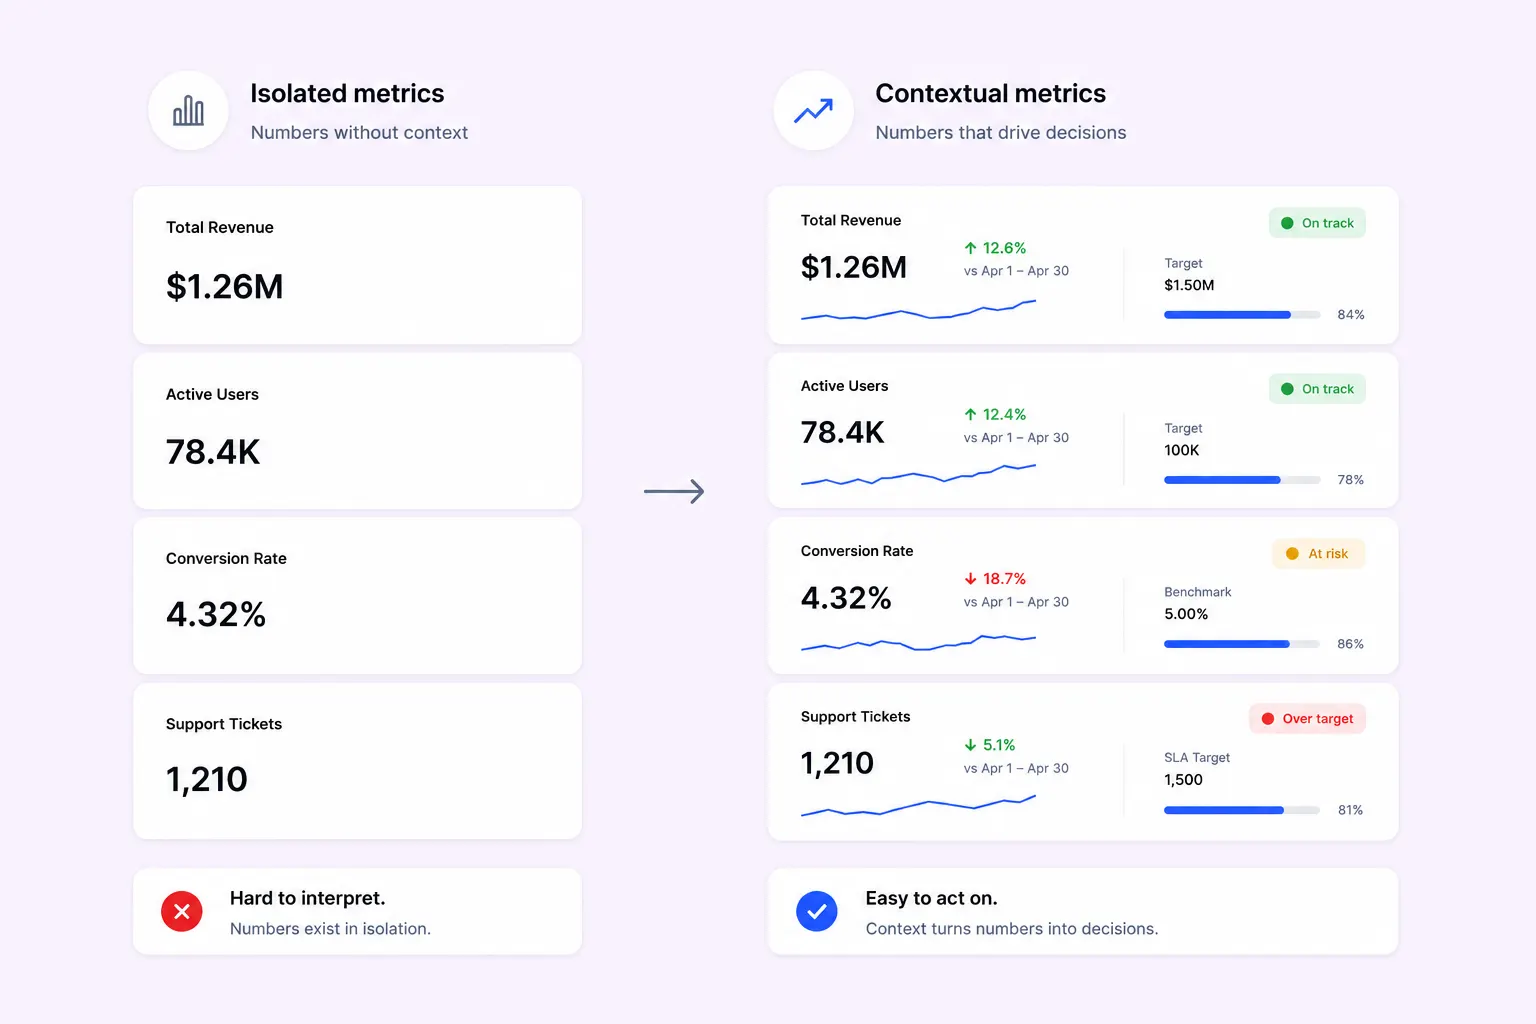
5. Numbers need context
$1.26M in revenue tells a user nothing. Up or down? Versus what? Over which period? Revenue, conversion rate, or churn only become meaningful when users understand whether performance improved, declined, or reached a target.
Every metric needs at least one context anchor:
- Period-over-period comparison (vs. last month, vs. same period last year)
- A target or threshold (78% of the monthly goal)
- A trend sparkline showing direction over time
- A status indicator (healthy / at risk / critical)
Reserve strong colors — red, amber, green — for status and alerts, and use them consistently. Color is the fastest signal on a dense screen. Spending it on decoration means losing it when it actually matters.
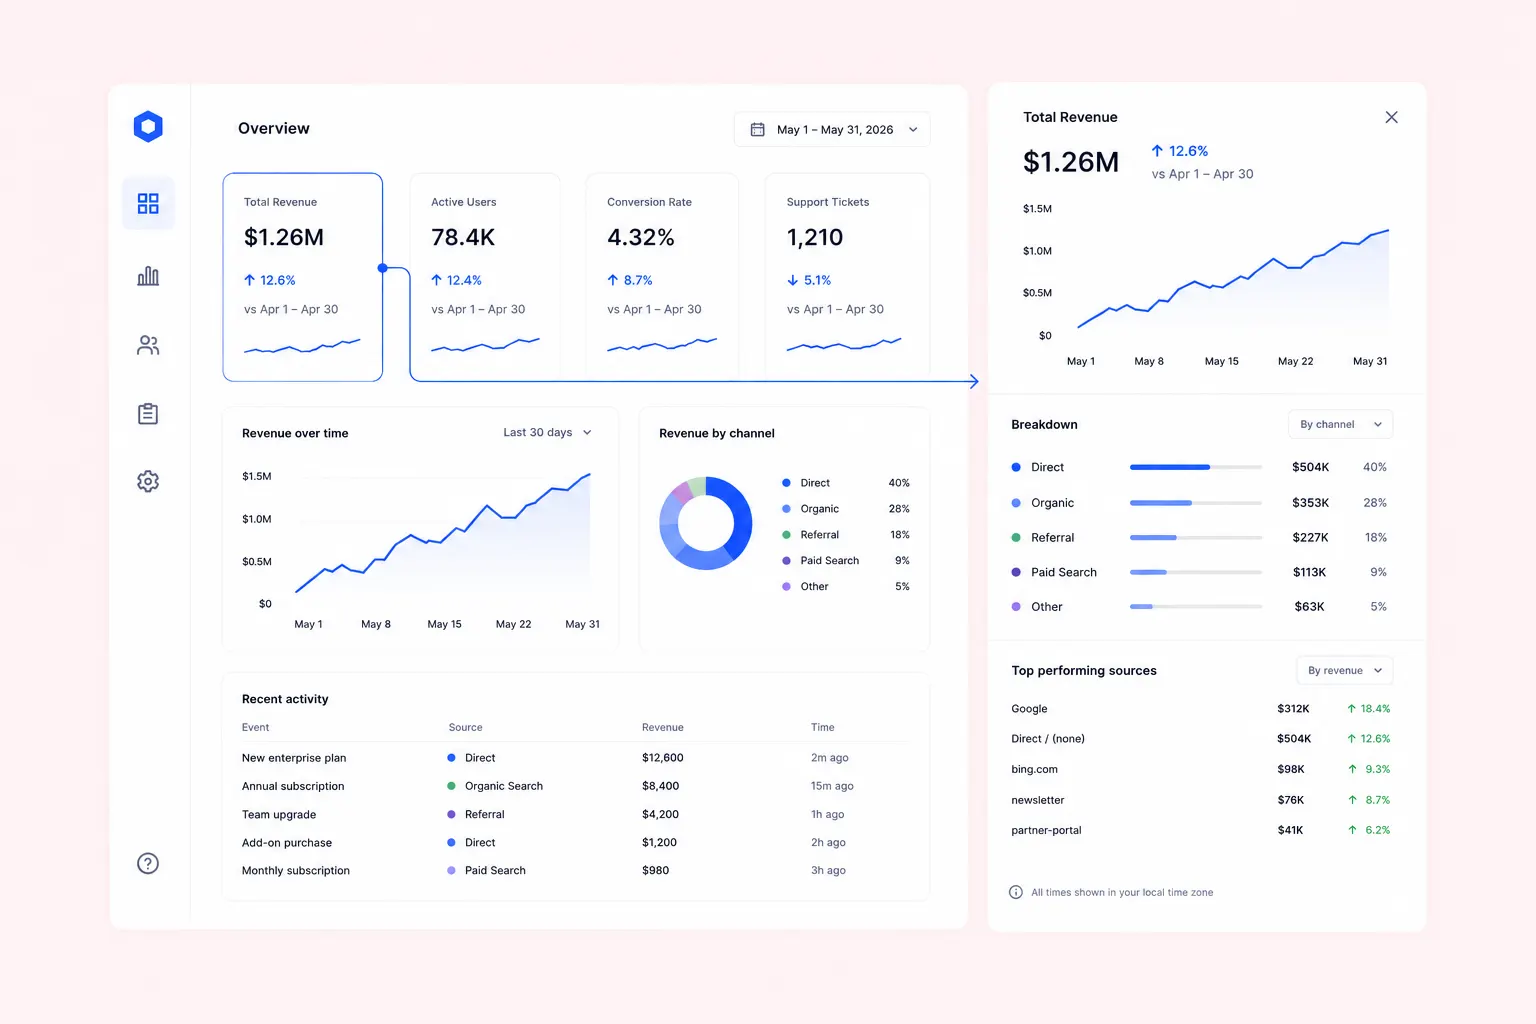
6. Navigation should stay out of the user's way
Users shouldn't spend time deciding where to go next. Their attention belongs to the task they're trying to complete.
Two strong patterns that hold up across product types:
Role-based defaults. Scope the opening view to the user's role and let them customize from there — not the reverse. New users don't know what they need yet; give them a curated starting point based on the most common use case for their role or tier.
Contextual drill-down. Embed exploration in place. Click a revenue number and a drawer reveals the breakdown by product, region, or cohort — without navigating away from the primary view. Users stay in their decision context instead of losing it.
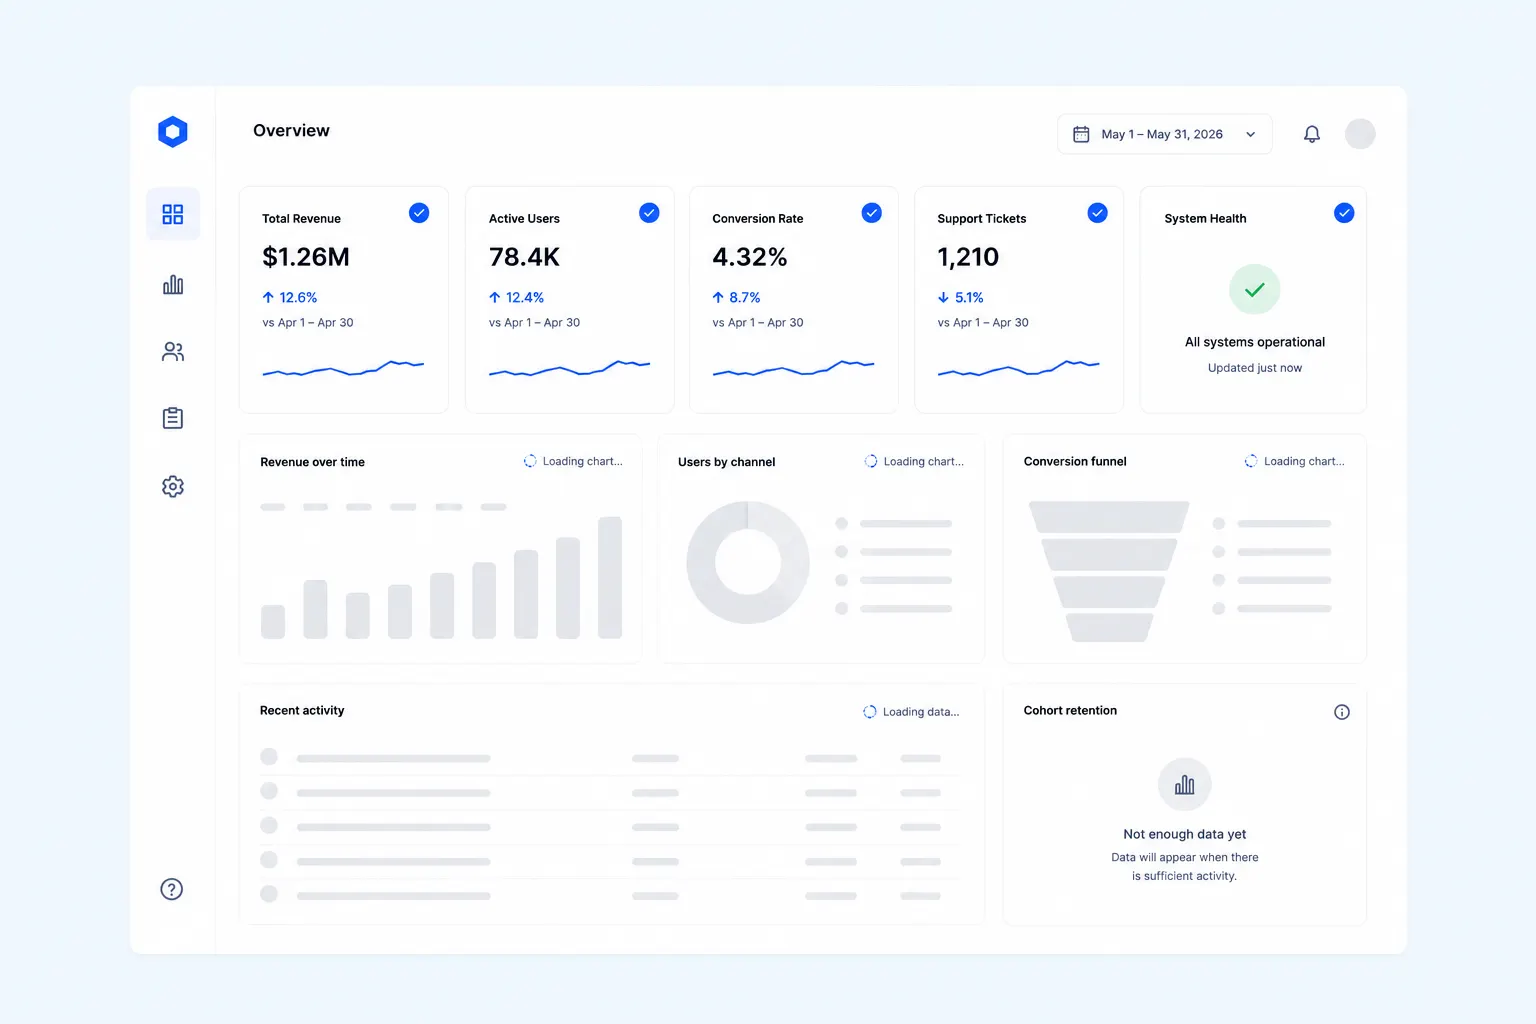
7. Loading behavior impacts on first impressions
Performance starts before data appears. Users form expectations while the interface loads, so the loading sequence deserves the same design attention as the finished dashboard.
Design for perceived performance: load the structural shell immediately with skeleton states for each component. Deliver primary KPIs first, secondary charts second, logs and tables last. If a data source is down, say so at the component level — a user should trust what's showing while knowing exactly what isn't.
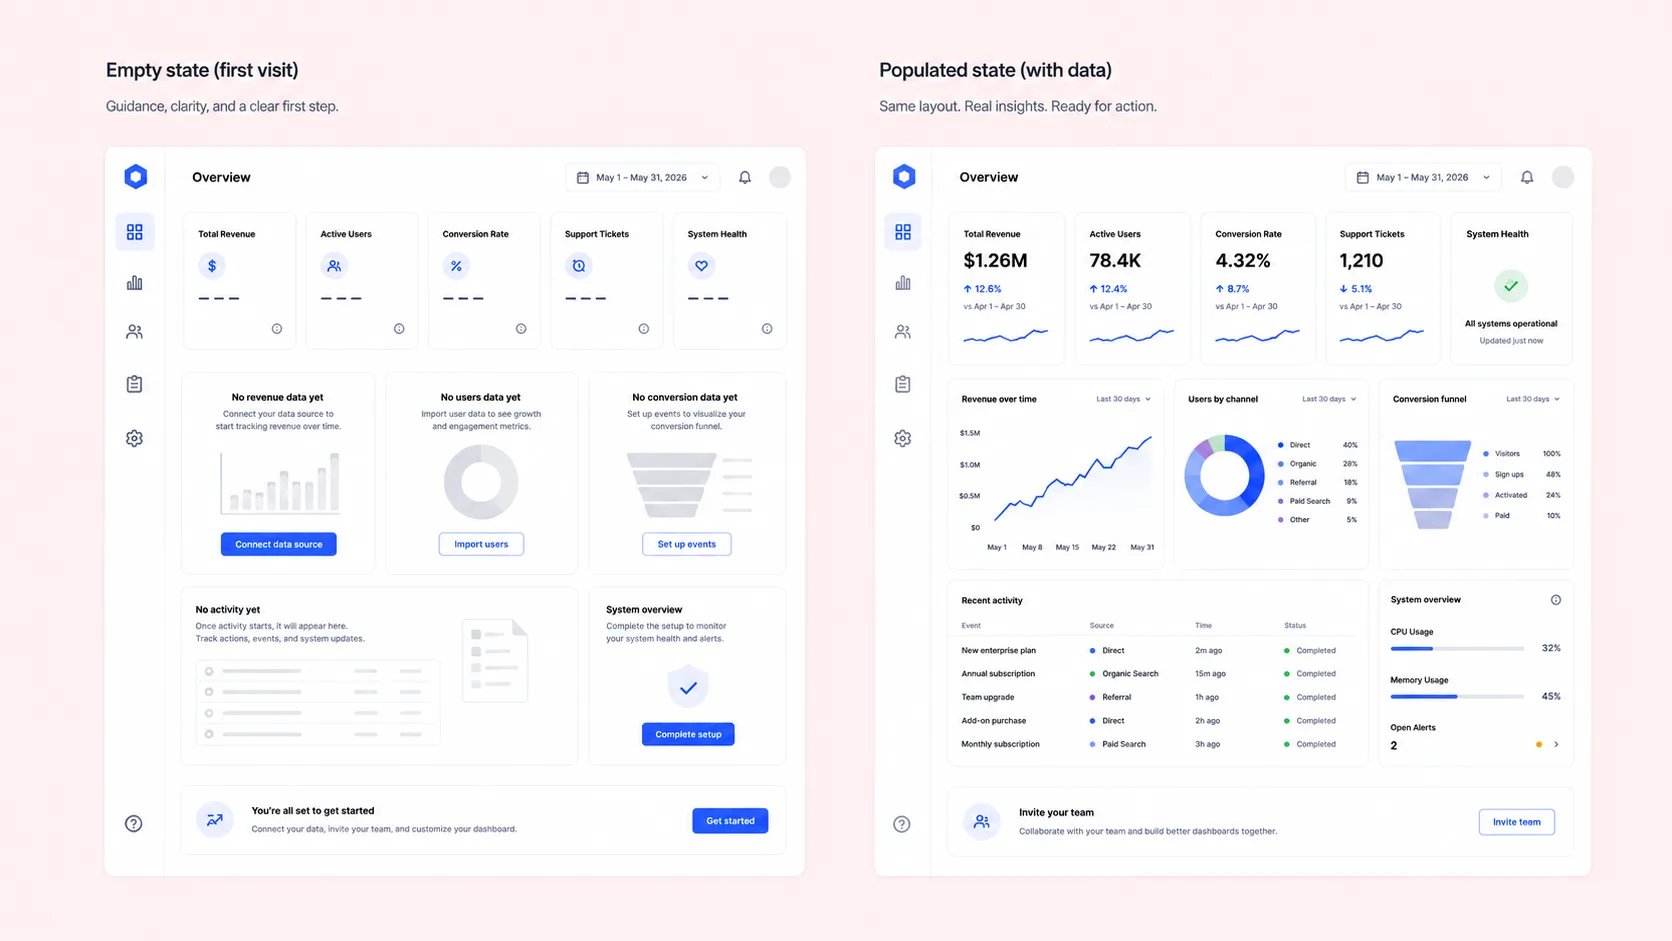
8. Design the empty state with the same care as the populated dashboard
Most dashboards are designed for their populated state. The empty state — new user, failed load, filter with no results — is treated as an edge case, costing real activation.
New users encounter an empty interface before they experience the product's value. Show what the dashboard will contain, explain how to populate it, and make the next action obvious.
When a filter returns nothing, "No results found" is the floor, not the solution. Suggest removing a filter, widening the date range, or checking the input. Every empty state should guide the user toward the next meaningful action.
If you're checking your own product against these eight points and finding more gaps than you'd like — let's get in touch, and we'll walk through them together.
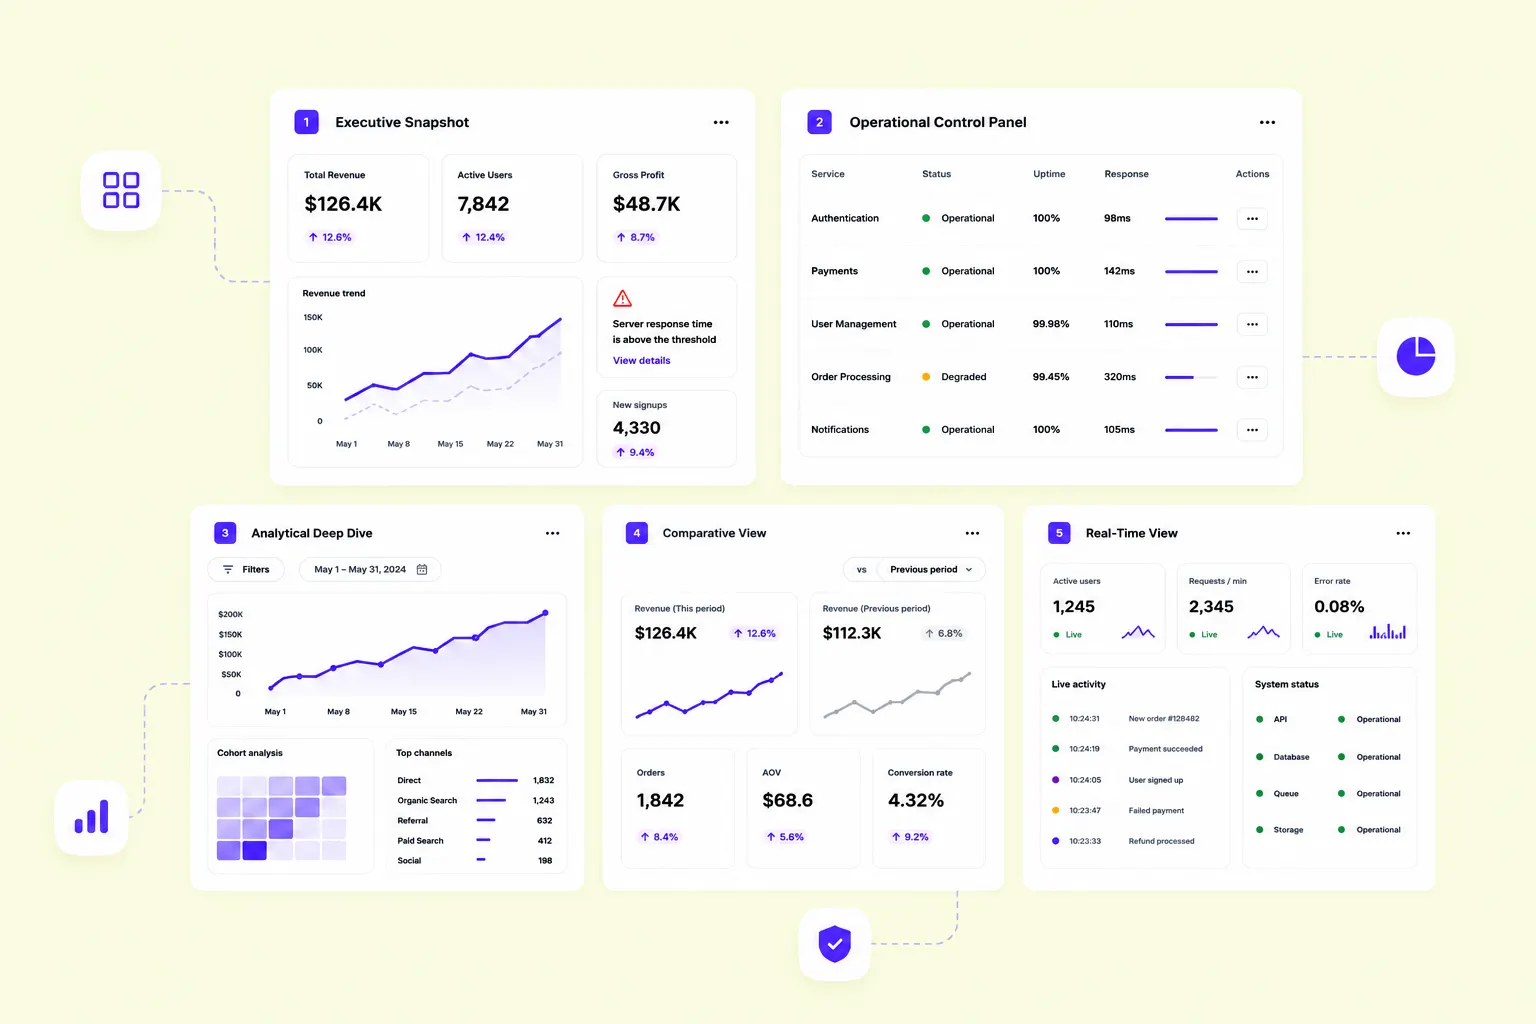
5 SaaS dashboard design patterns that help users act faster
The pattern you choose determines how users experience everything on top of it. Choosing wrong is one of the most common reasons a dashboard underperforms, even when the data is right.
- Executive snapshot. A few high-level KPIs, trend indicators, and anomaly signals. Decision-makers need the full picture in under ten seconds. Stat cards with delta values let executives confirm or escalate without reading a chart.
- Operational control panel. Real-time data, status indicators, and inline actions. Built for people who live in the product all day. The measure of success: how fast can a user spot a problem and act on it without switching screens?
- Analytical deep-dive. Filters, cohort comparisons, drill-downs, and period selectors. The interface steps back. This pattern serves analysts following a specific thread — not monitoring a general state.
- Comparative view. Metrics placed side by side — across time periods, teams, products, or segments. Without comparison, a 12% conversion rate is a number. With it, it's a signal. Especially effective in B2B SaaS, where managers track performance across accounts or regions.
- Real-time view. Auto-refreshing data, live counters, and color-coded status indicators. Built for teams who need to respond before a problem escalates. Common in logistics, infrastructure monitoring, and customer support SaaS.
Most products need more than one pattern across different sections or roles. The mistake is applying the one the team knows best across the entire product.
7 SaaS dashboards we designed for our customers
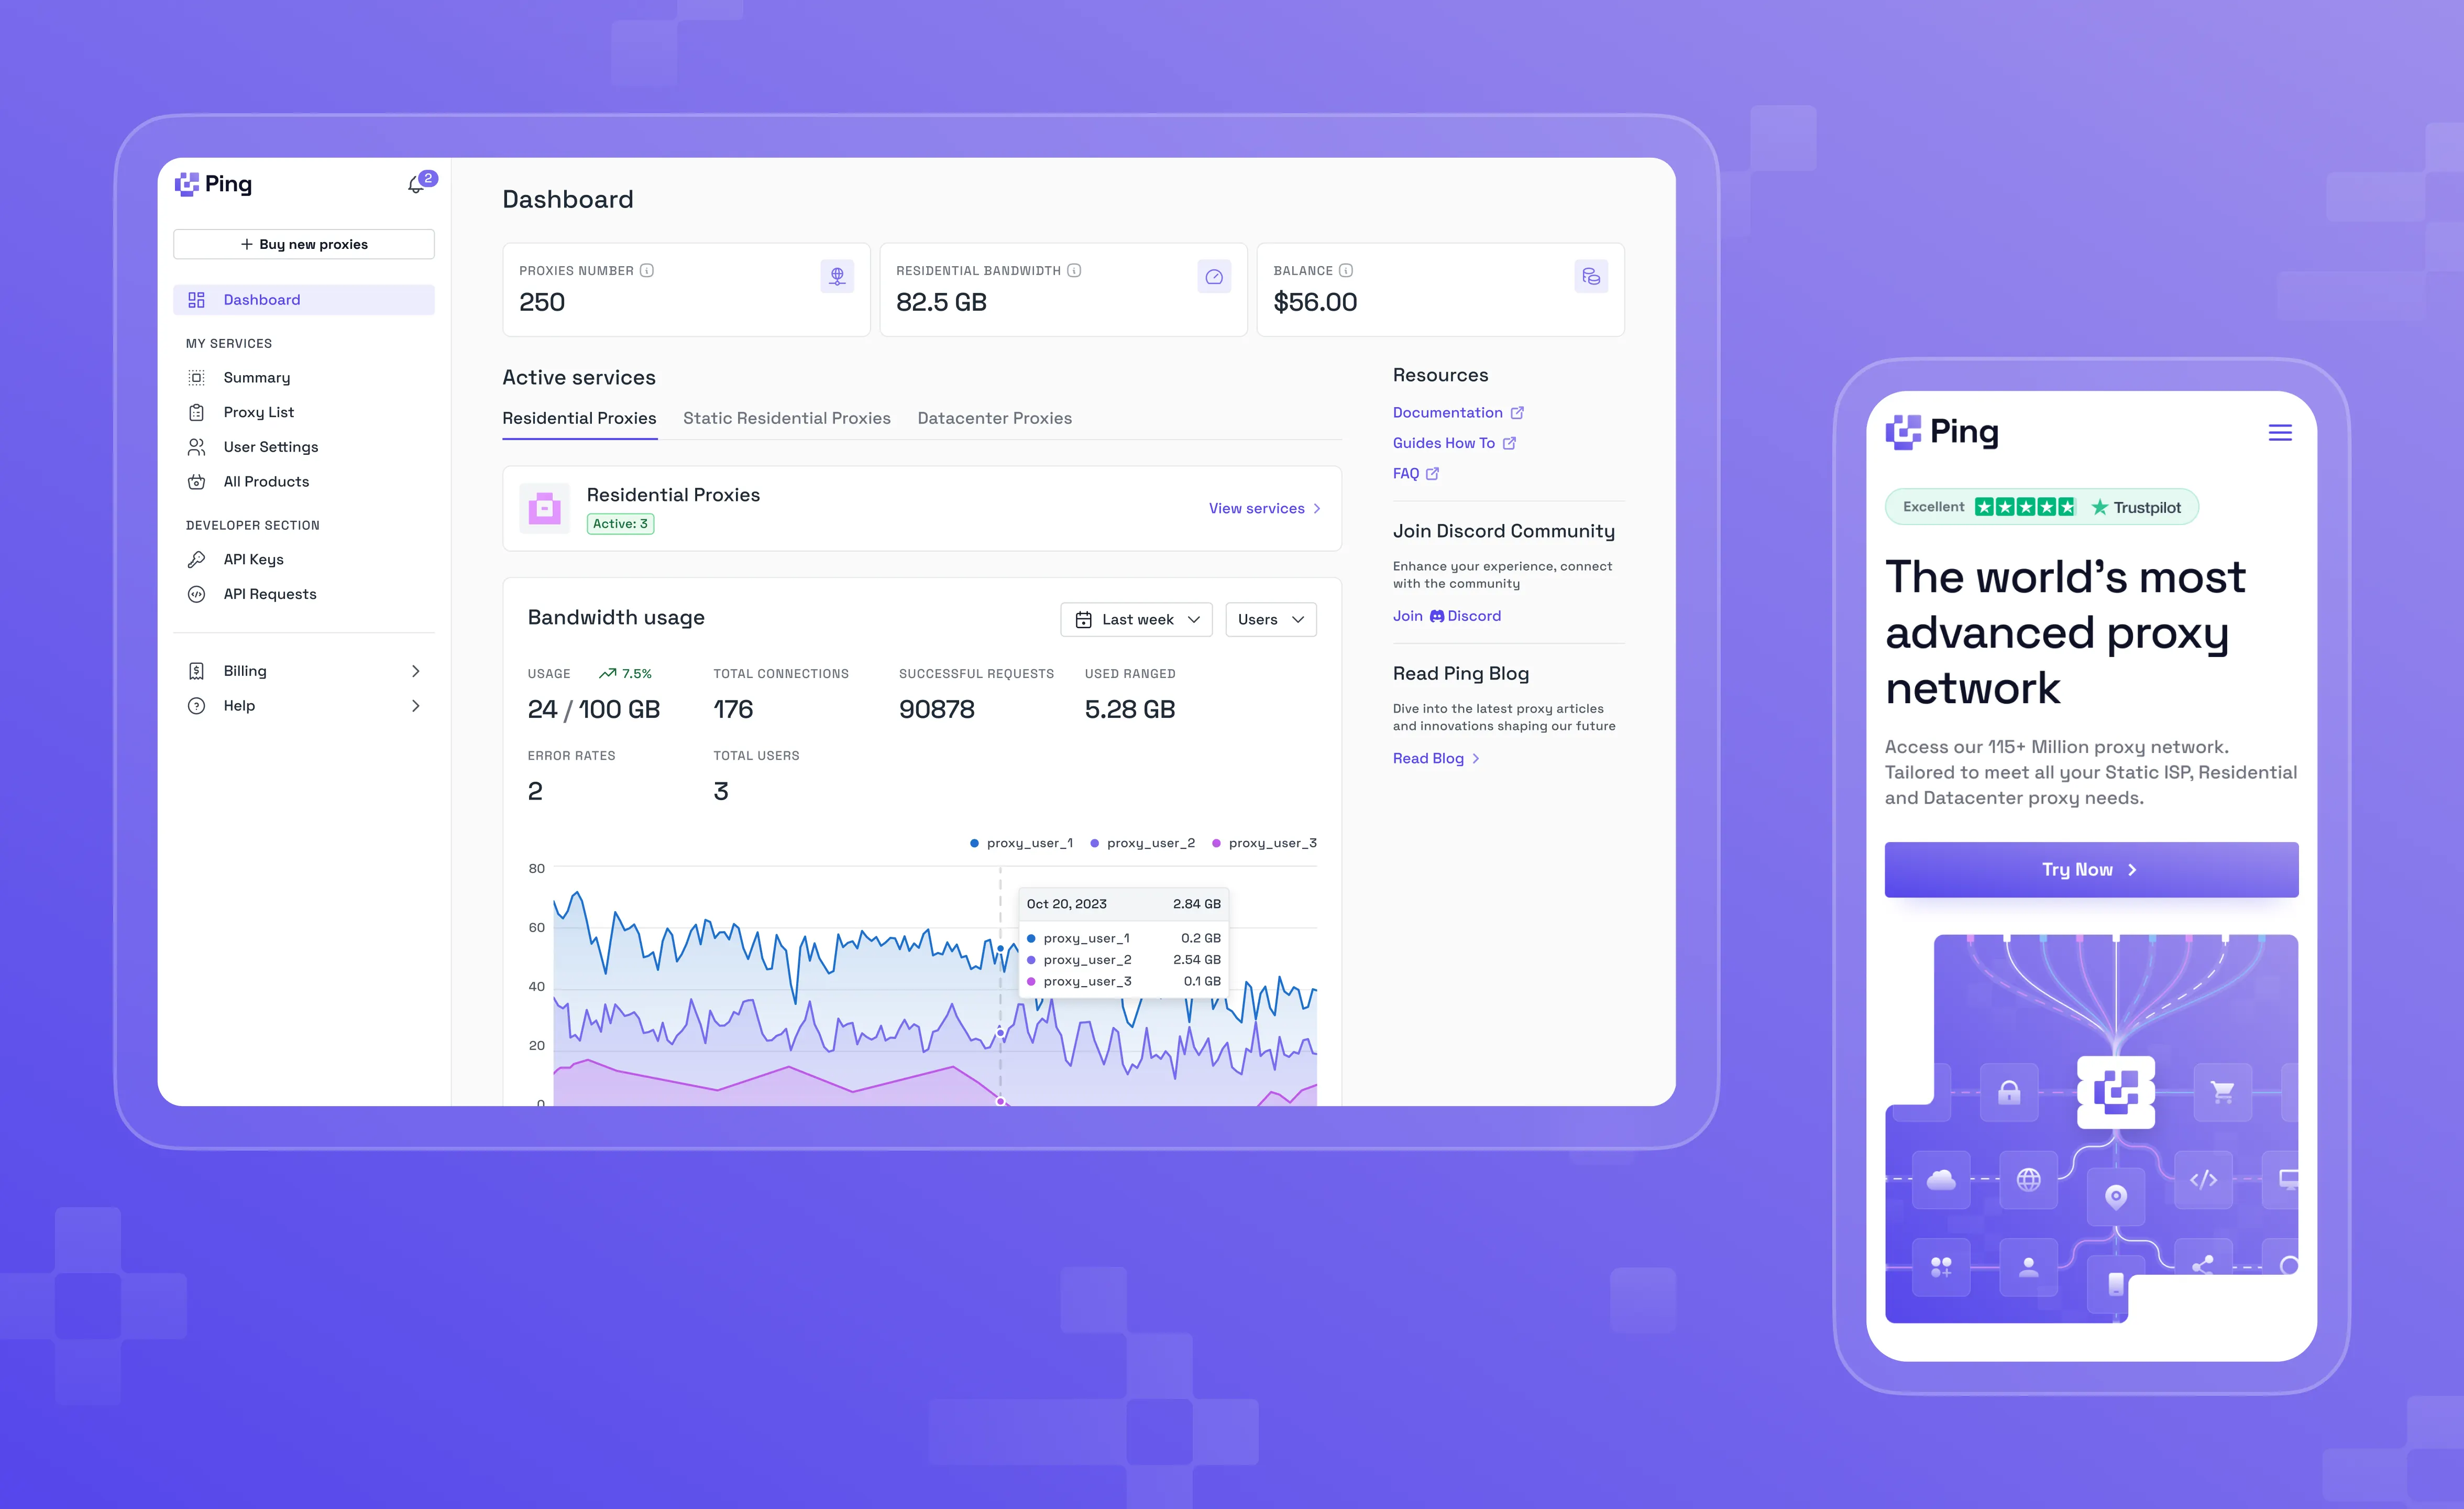
Byteful (ex. Ping Proxies) — proxy network management dashboard
Byteful is a B2B proxy infrastructure platform for developers and technical buyers. The dashboard answers three operational questions on login: are my proxies active, how much bandwidth have I used, and is my account funded?
Read the full Ping Proxies case study here
A little breakdown of what’s inside:
- Three stat cards (Proxies Number, Residential Bandwidth, Balance), each mapped directly to a specific action — scale, upgrade, or top up.
- "+ Buy new proxies" CTA pinned top of sidebar — the next step is always one click away, regardless of what the dashboard shows.
- Active Services tab structure with a green "Active: 3" status badge — service health confirmed without opening a single tab.
- Bandwidth usage shown as 24/100 GB with a trend arrow — consumption-versus-limit format that makes headroom immediately visible.
- Multi-user area chart with per-user breakdown on hover, shifting the view from aggregate monitoring to accountable analysis.
- Resources panel (Docs, Guides, FAQ, Discord) in permanent peripheral view — support accessible without navigation.
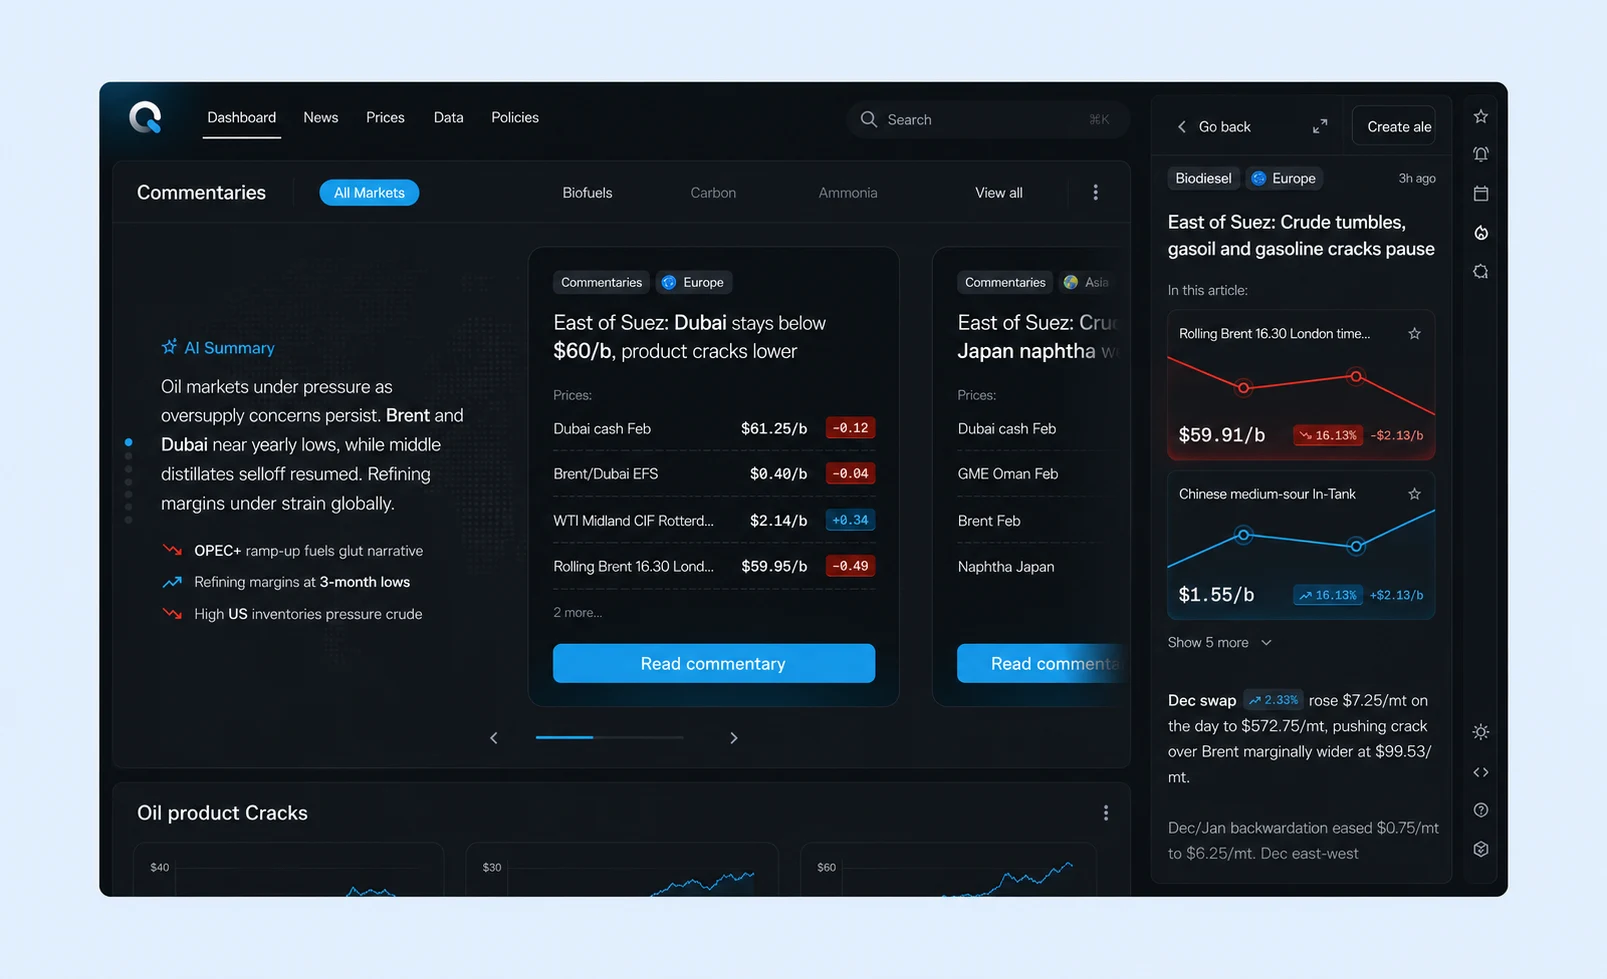
Quantum — market data dashboard for energy traders
QCI is a commodity intelligence platform for energy market professionals. The challenge: surface fast-moving price data, AI-generated market summaries, and editorial commentary in a single view — without turning a high-stakes trading screen into a news feed.
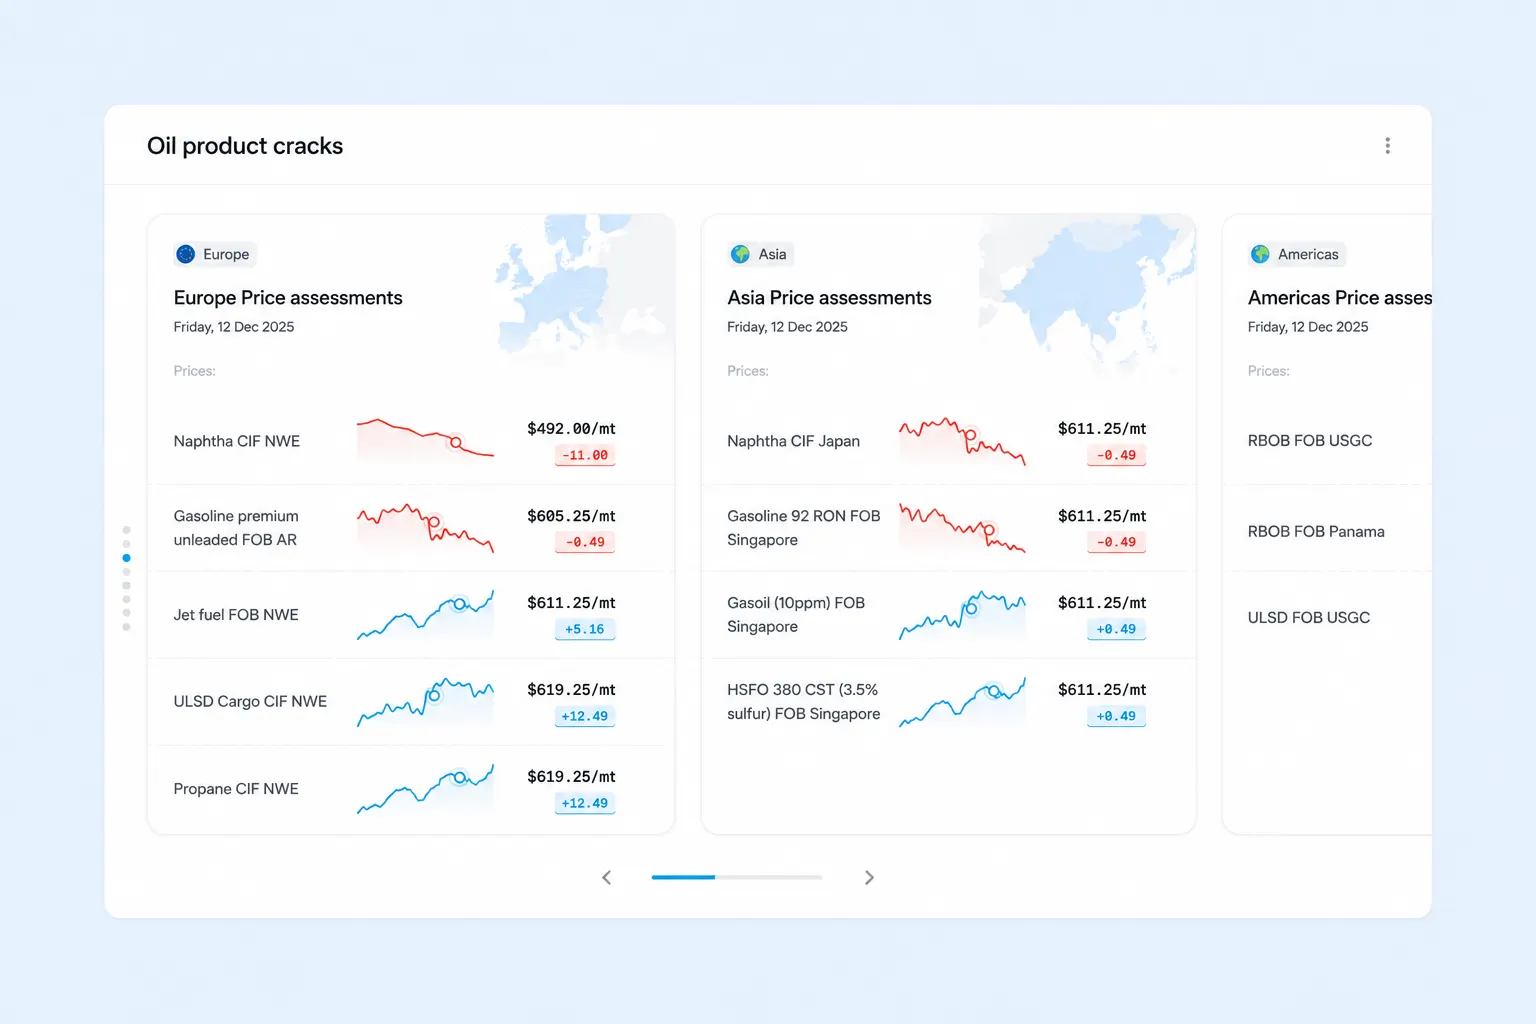
A little breakdown of what’s inside:
- AI Summary panel with plain-language market brief and color-coded signal bullets — a pre-read layer before traders engage with raw prices.
- Commentary cards with inline price tables per article — price context inside the editorial, not in a separate tab.
- Color-coded delta badges on every price row for instant directional scanning across instruments.
- Right-side article drawer with embedded mini price charts, turning editorial context into a live data panel.
- Oil Product Cracks section uses region-scoped cards (Europe, Asia, Americas) with per-instrument sparklines — red for declining prices, blue for rising — so a trader reads direction by color before reading a number.
- Dark mode throughout to reduce visual fatigue across long monitoring sessions.
- Global search (⌘K) and persistent top navigation keep the full platform one keystroke away.
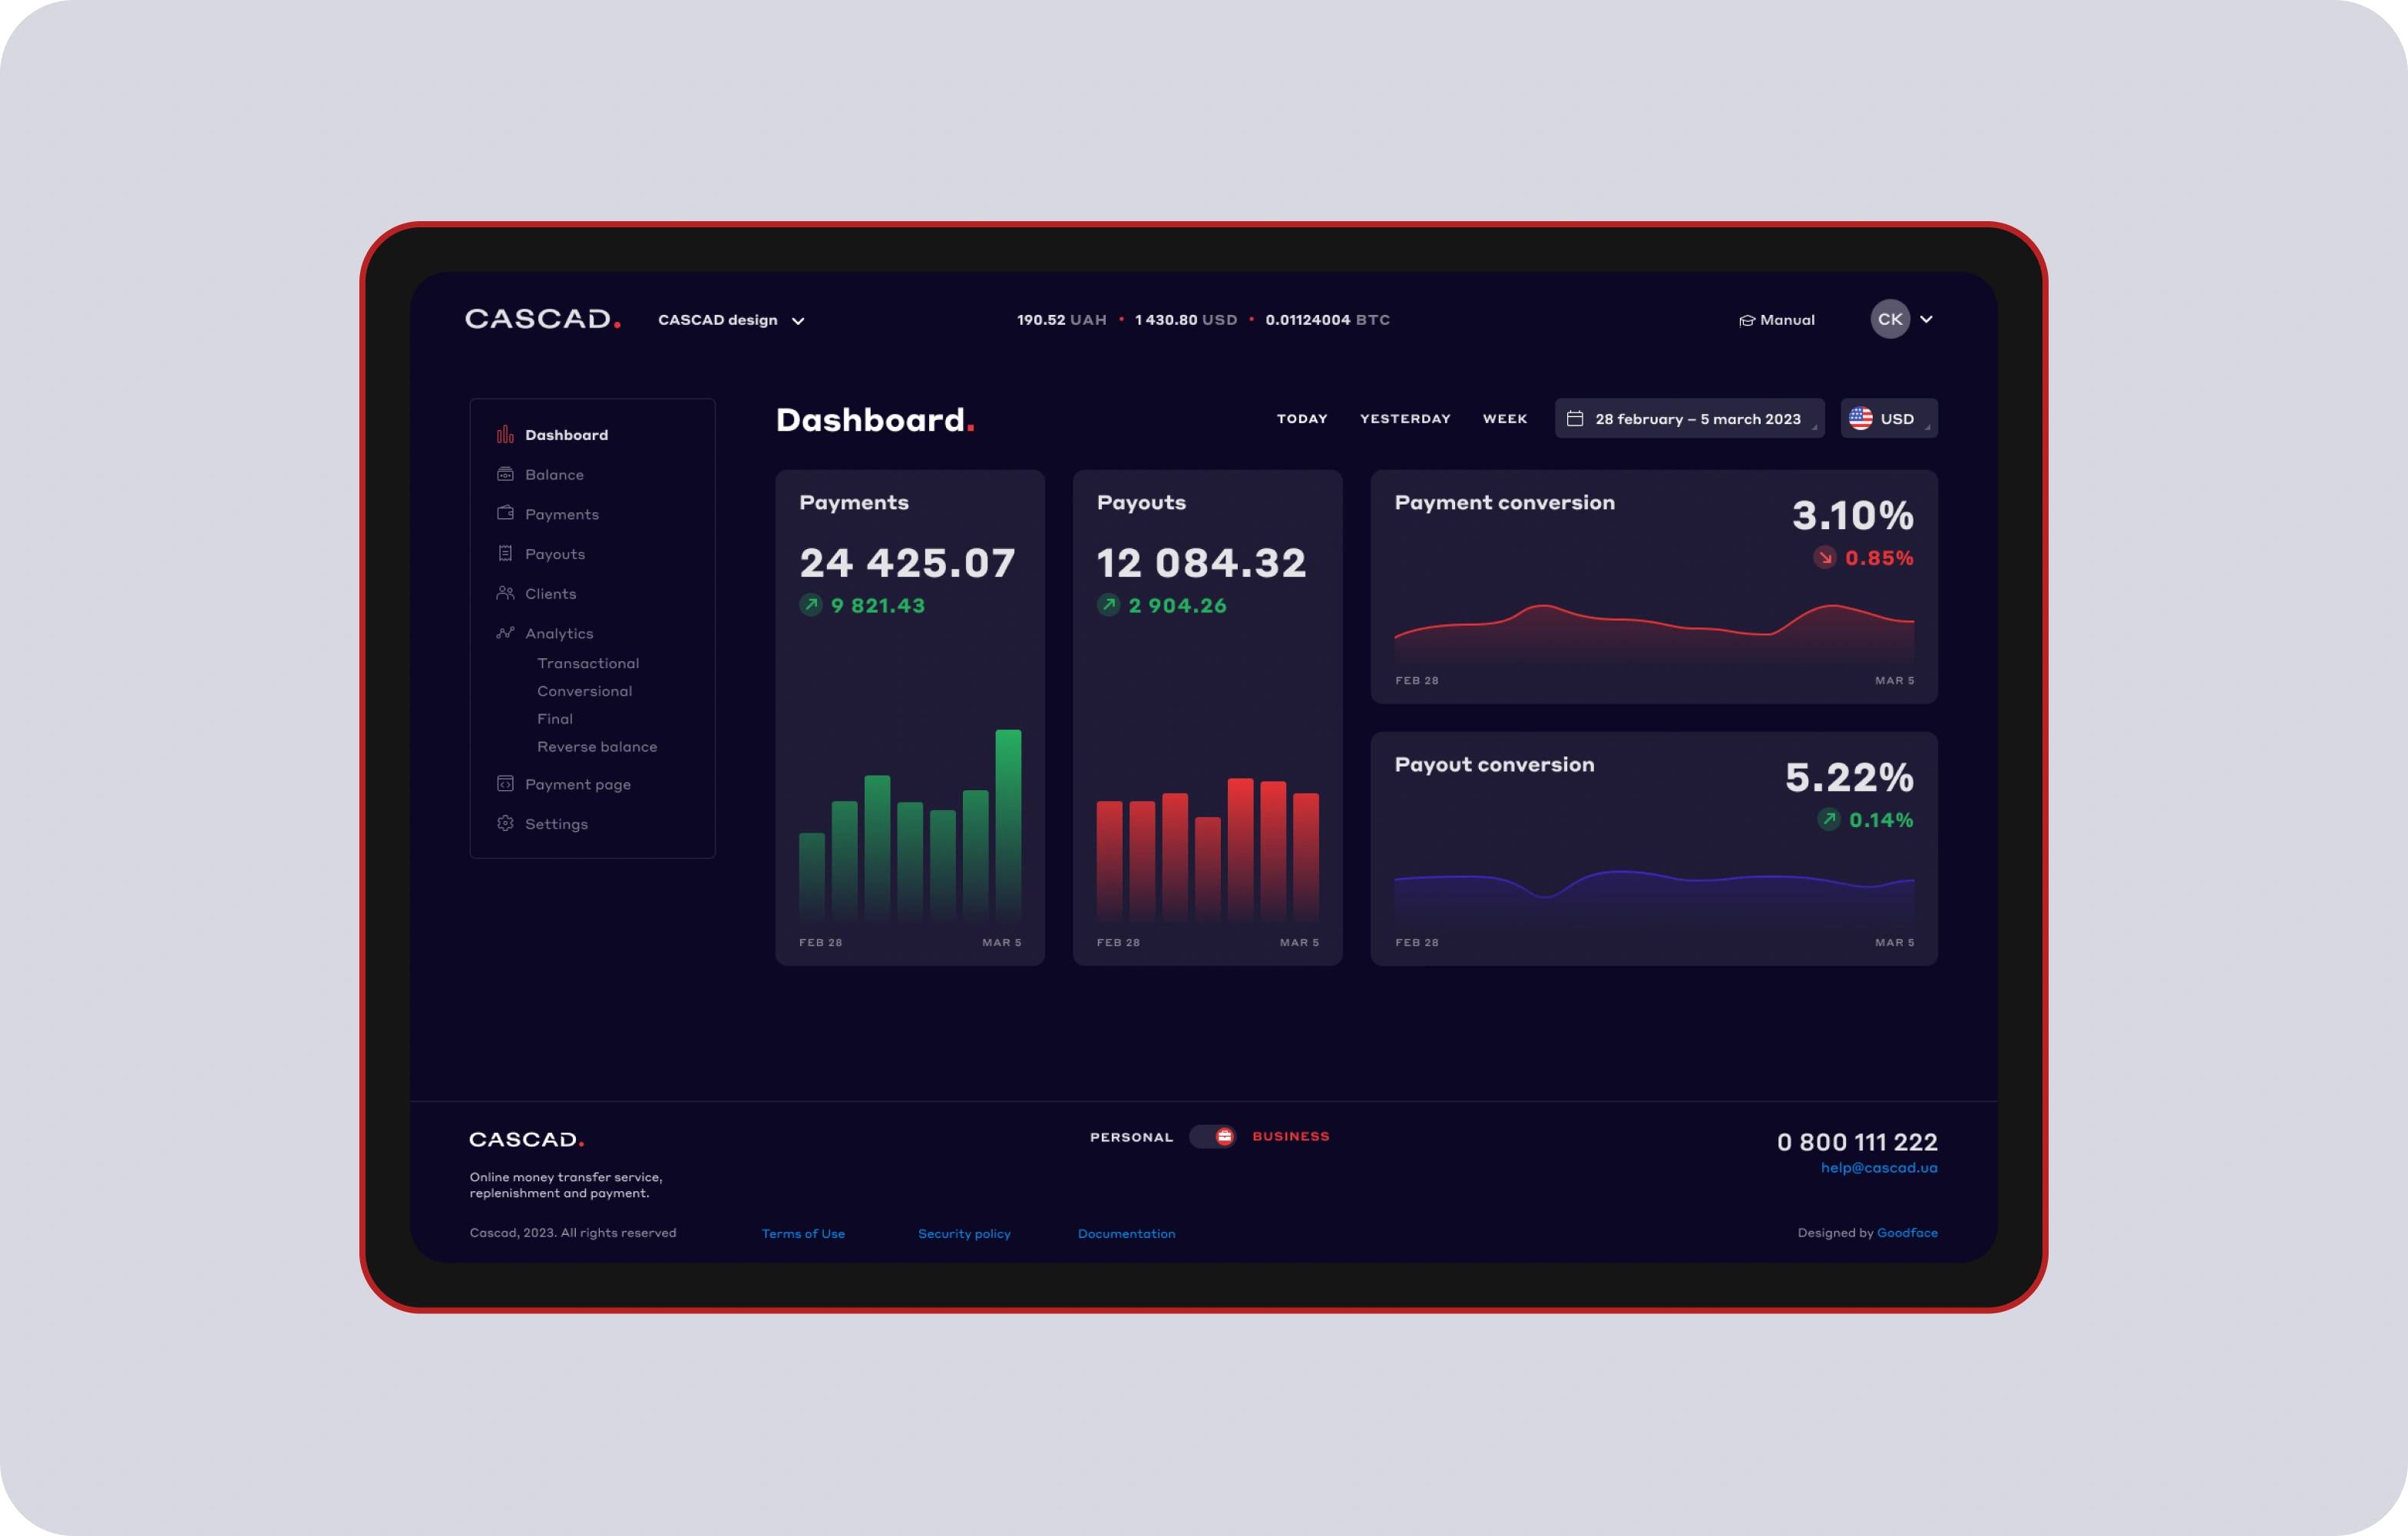
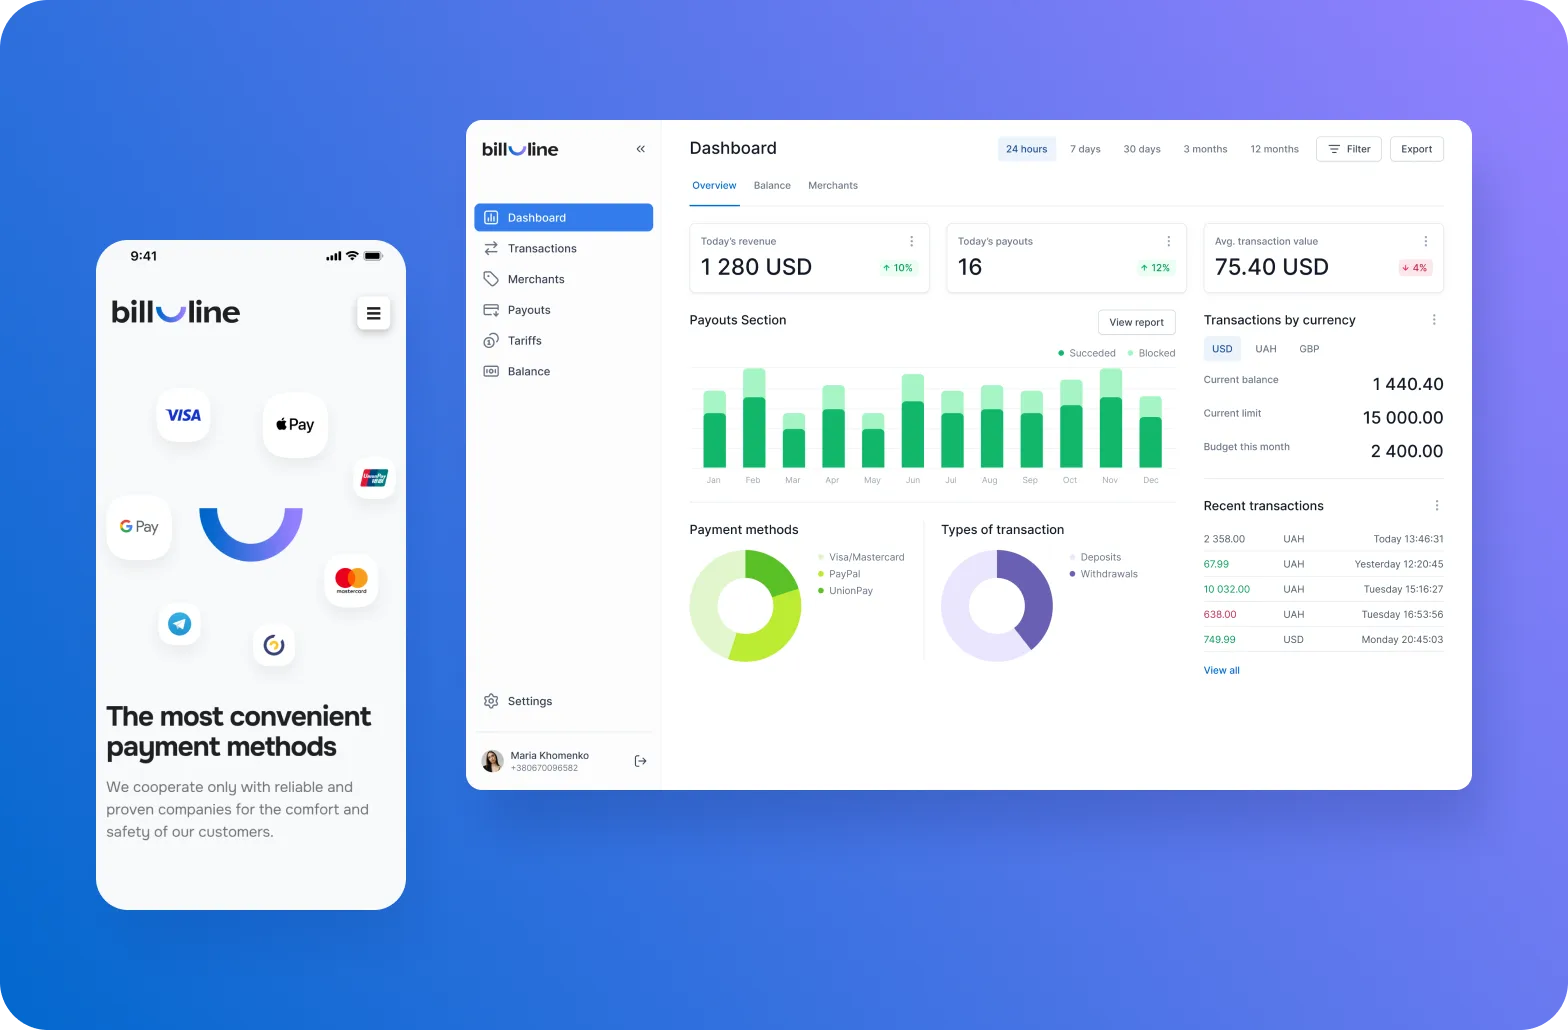
Cascad — online money transfer and payment dashboard
Cascad is a payment platform that helps finance teams instantly understand whether money is moving as expected and whether conversion rates remain healthy across multiple currencies.
See the full Cascad case study
A little breakdown of what’s inside:
- Four full-width cards — Payments, Payouts, Payment Conversion, Payout Conversion — each with an embedded sparkline, so the number and its trend occupy the same visual unit.
- Color reserved entirely for data signal: green bars for healthy volume, red for variance, gradient fills on conversion line charts matching their direction.
- Multi-currency balance (UAH · USD · BTC) pinned to the global nav bar — account position always visible, no extra click required.
- Date range controls (Today / Yesterday / Week / Custom) are persistent top-right, scoping every figure on the page simultaneously.
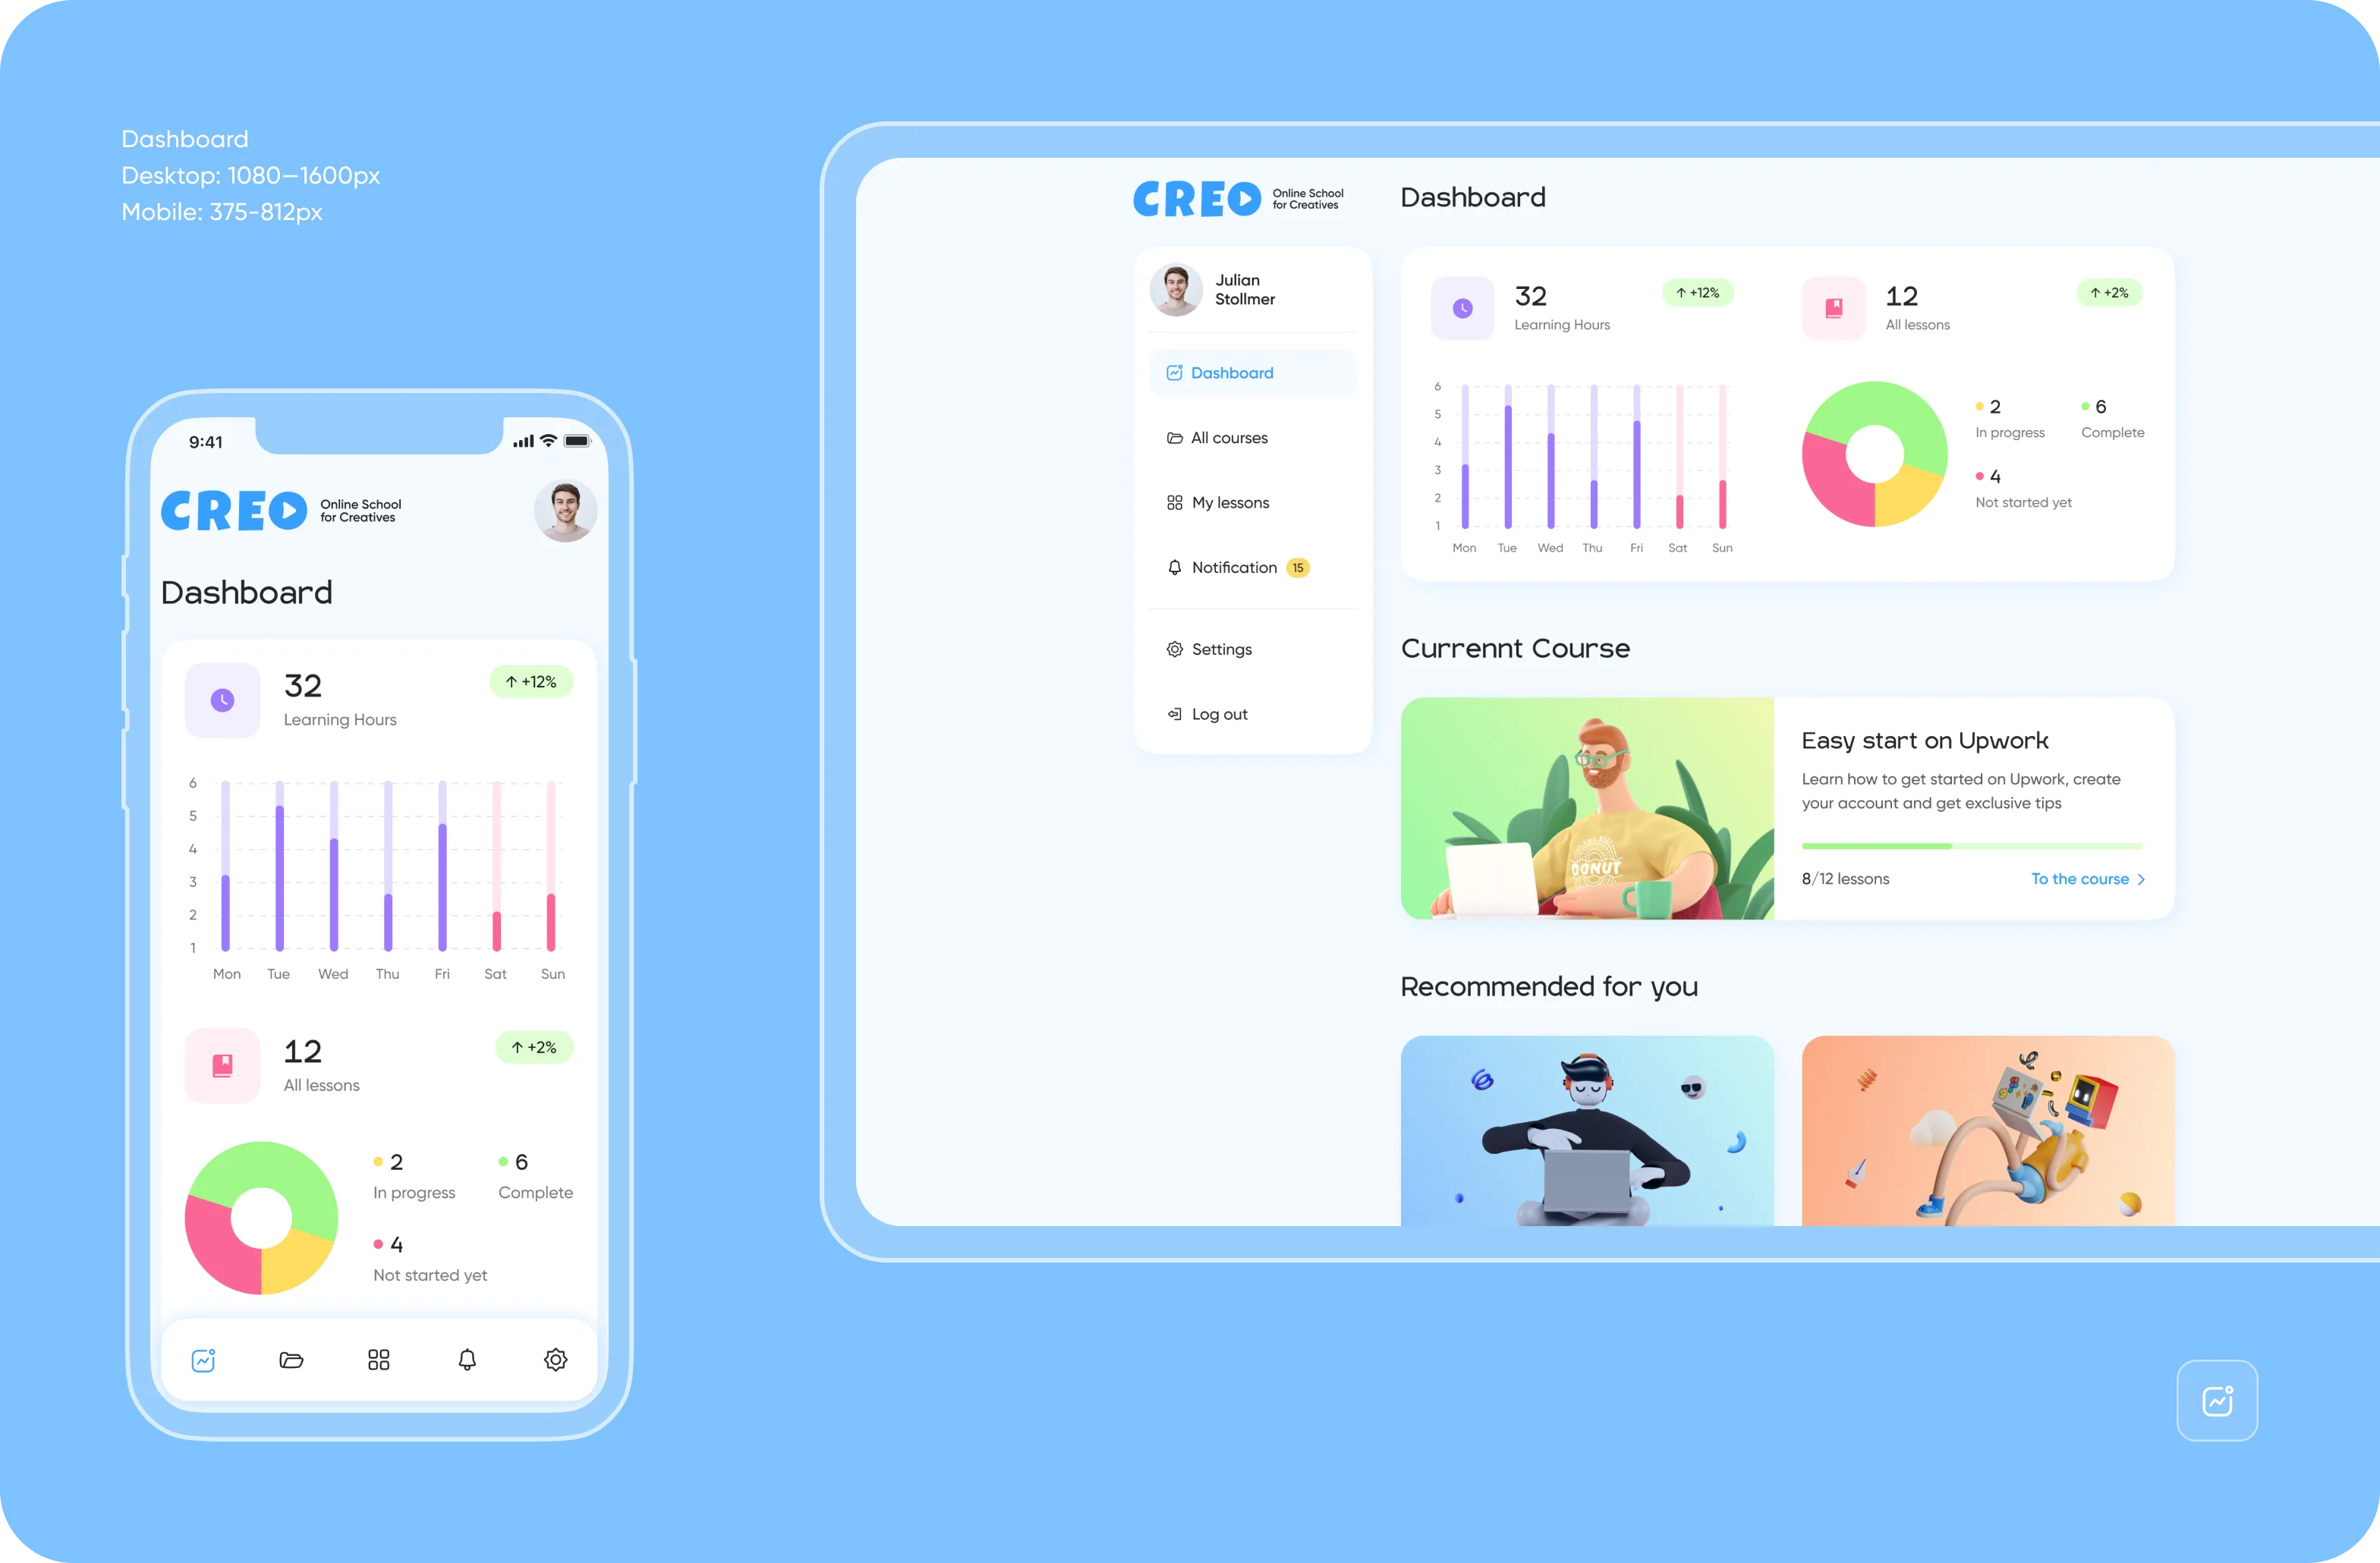
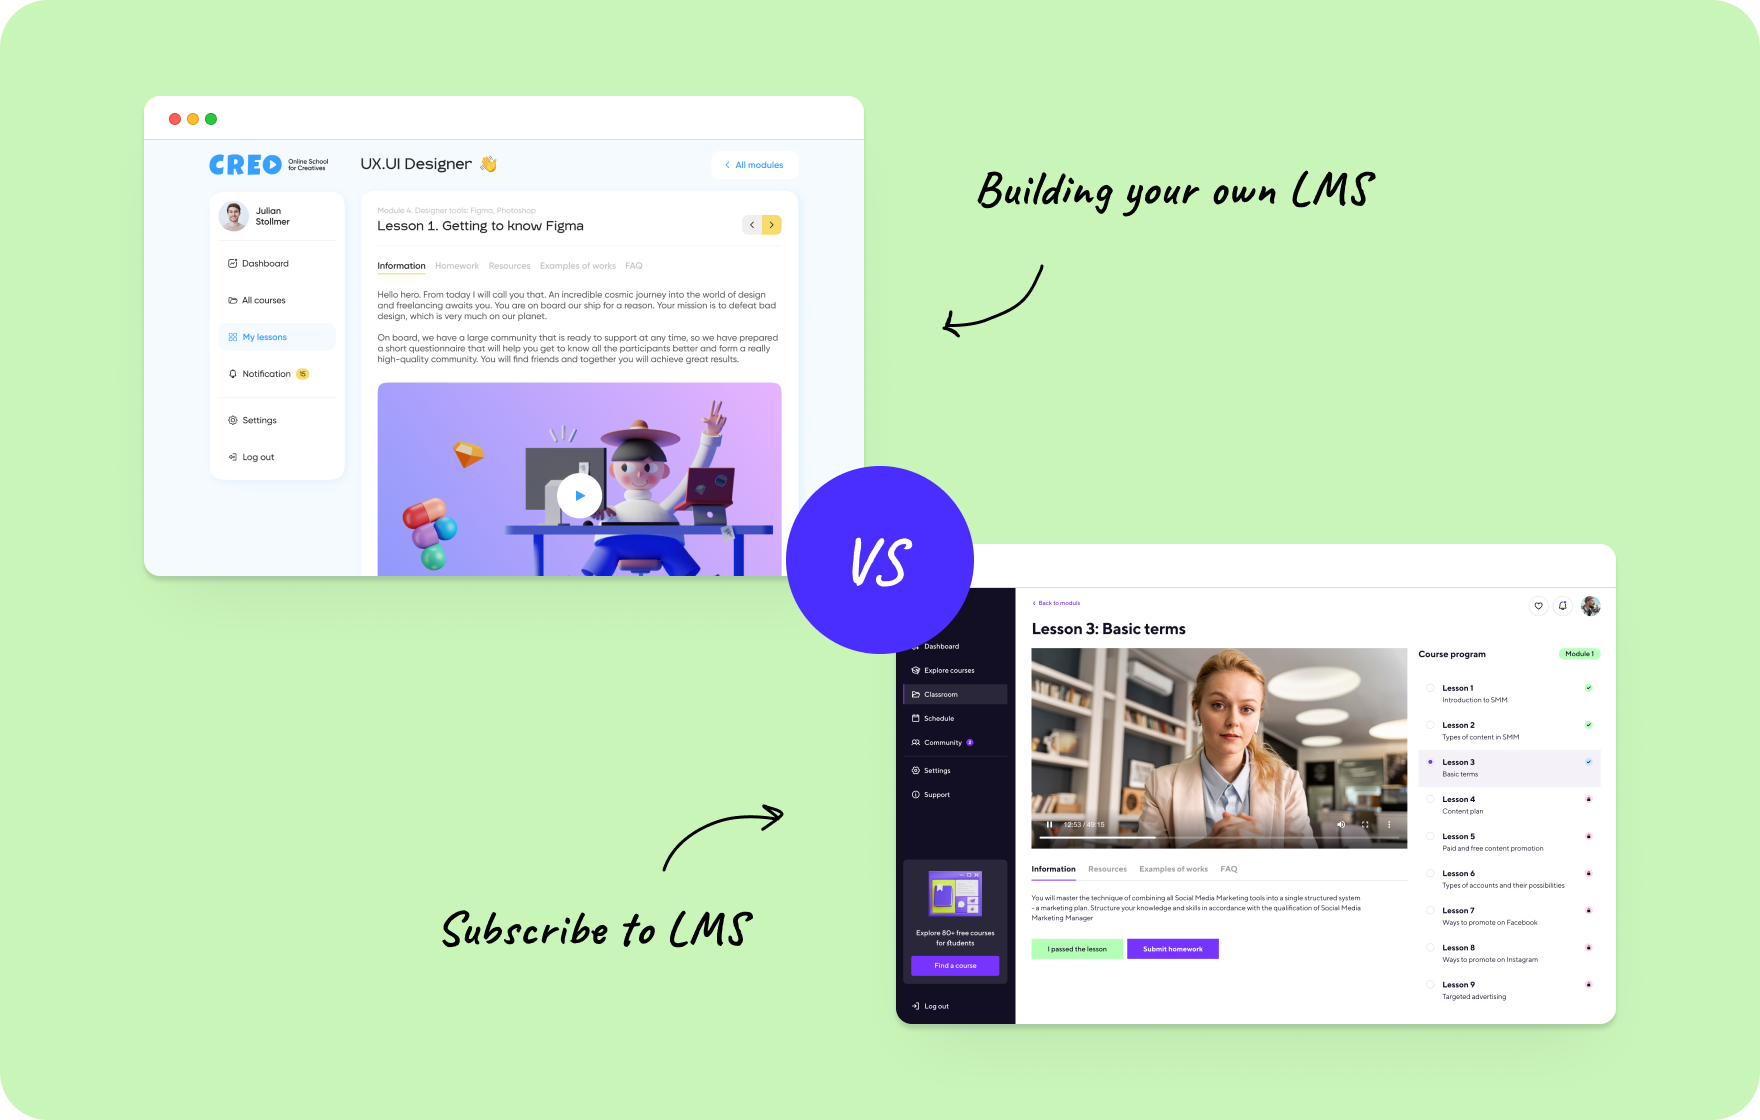
Creo — a dashboard for an online school for creatives
This LMS dashboard serves a learner who checks in between sessions to see where they stand, what's in progress, and what to tackle next — motivation built into the interface.
Read the full CREO case study
A little breakdown of what’s inside:
- Two stat cards (Learning Hours, All Lessons) with green percentage deltas front and center — progress visibility as a retention lever.
- Weekly activity bar chart with a color split between completed and active days, making the shape of the week readable at a glance.
- Lesson completion donut (In Progress / Complete / Not Started) replacing a table — distribution visual and proportional, no reading required.
- Current Course card with a progress bar and direct "To the course →" link, collapsing "where am I / what's next" into a single interaction.
- Full mobile parity at 375px — same information architecture, nothing deferred to desktop.
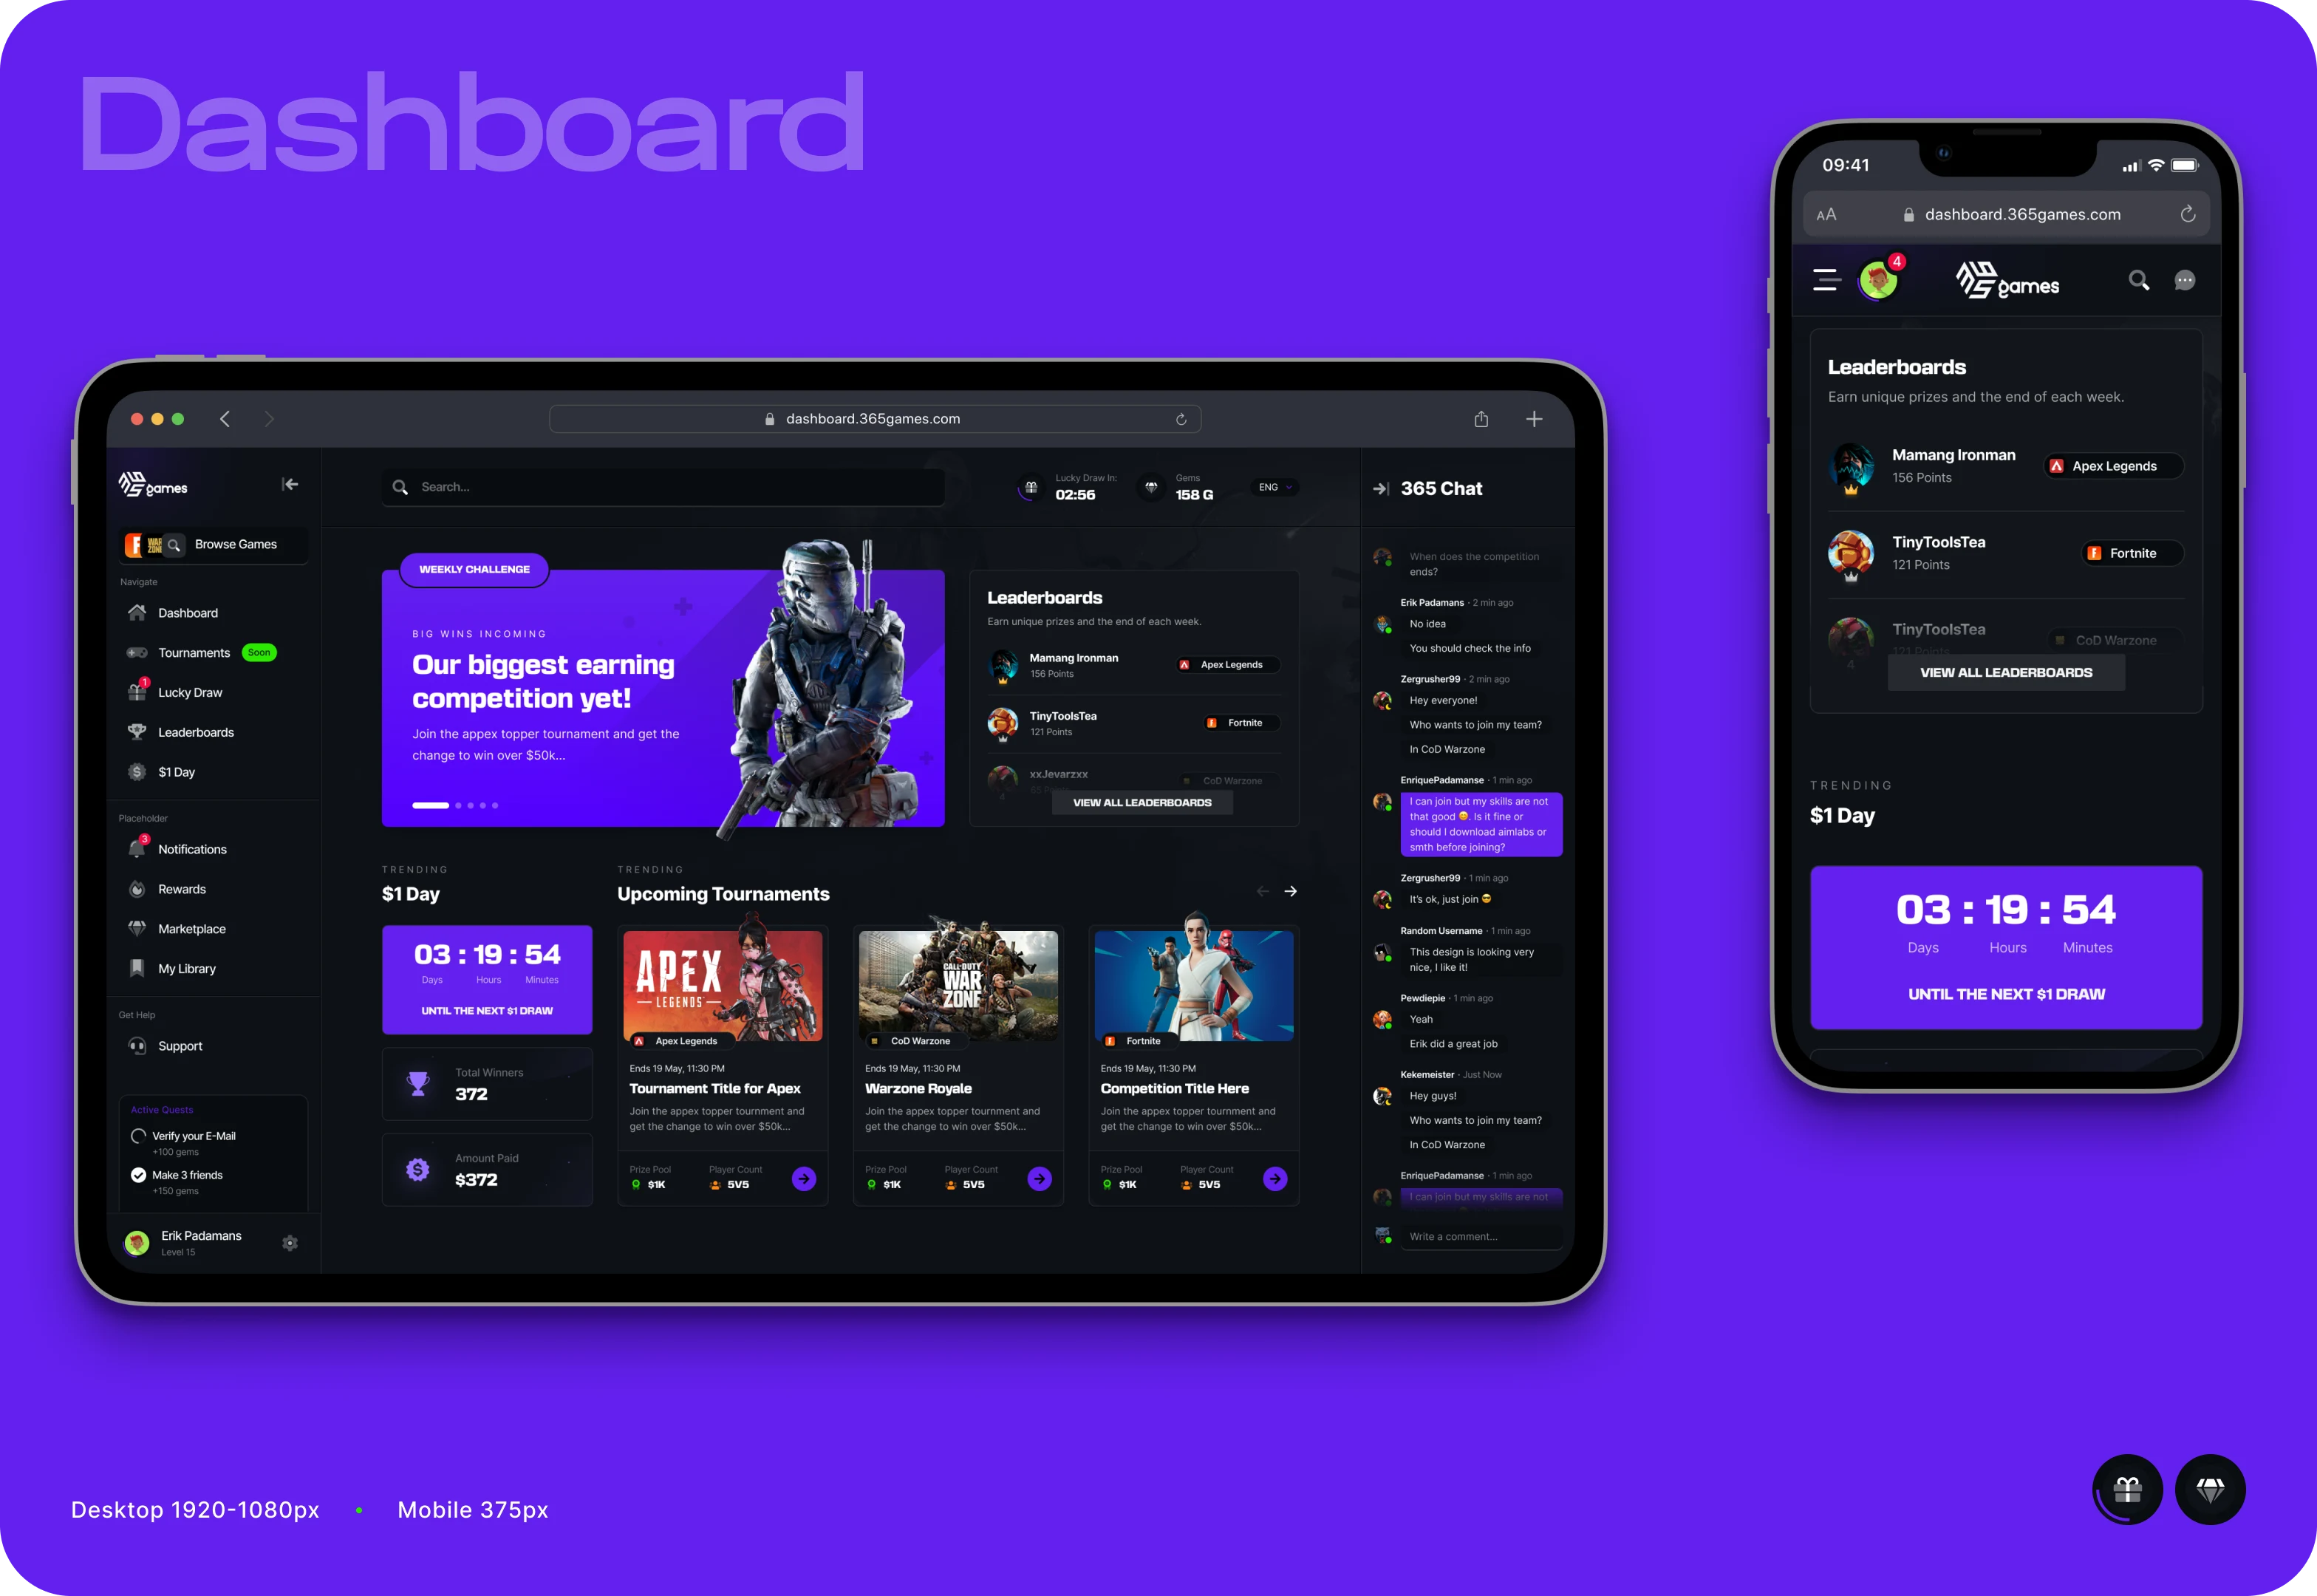
365 Games — eSports dashboard for a gaming platform
365games is a competitive environment where users chase tournaments, leaderboards, and prize draws. The dashboard drives engagement as much as it reports it — every element pushes toward the next action.
See the full 365games case study
A little breakdown of what’s inside:
- Full-width Weekly Challenge hero banner as the primary conversion surface, positioned exactly where the eye lands first.
- Live $1 Day countdown timer (Days / Hours / Minutes) and prize pool surfaced in the trending section — urgency made visible.
- Upcoming Tournaments cards showing real end times, prize pools, and player counts for three games side by side.
- 365 Chat live feed running alongside the Leaderboards panel — perceived platform activity that signals competition is happening right now.
- Gamification state (user level, active quests, progress indicators) is persistent in the sidebar's bottom, always in peripheral view.
Bill_line — payment management dashboard
bill_line is a payment platform for merchants. We designed two fintech dashboards: an account overview for platform health monitoring and a transaction history view for investigating day-to-day activity. Each supports a different user goal.
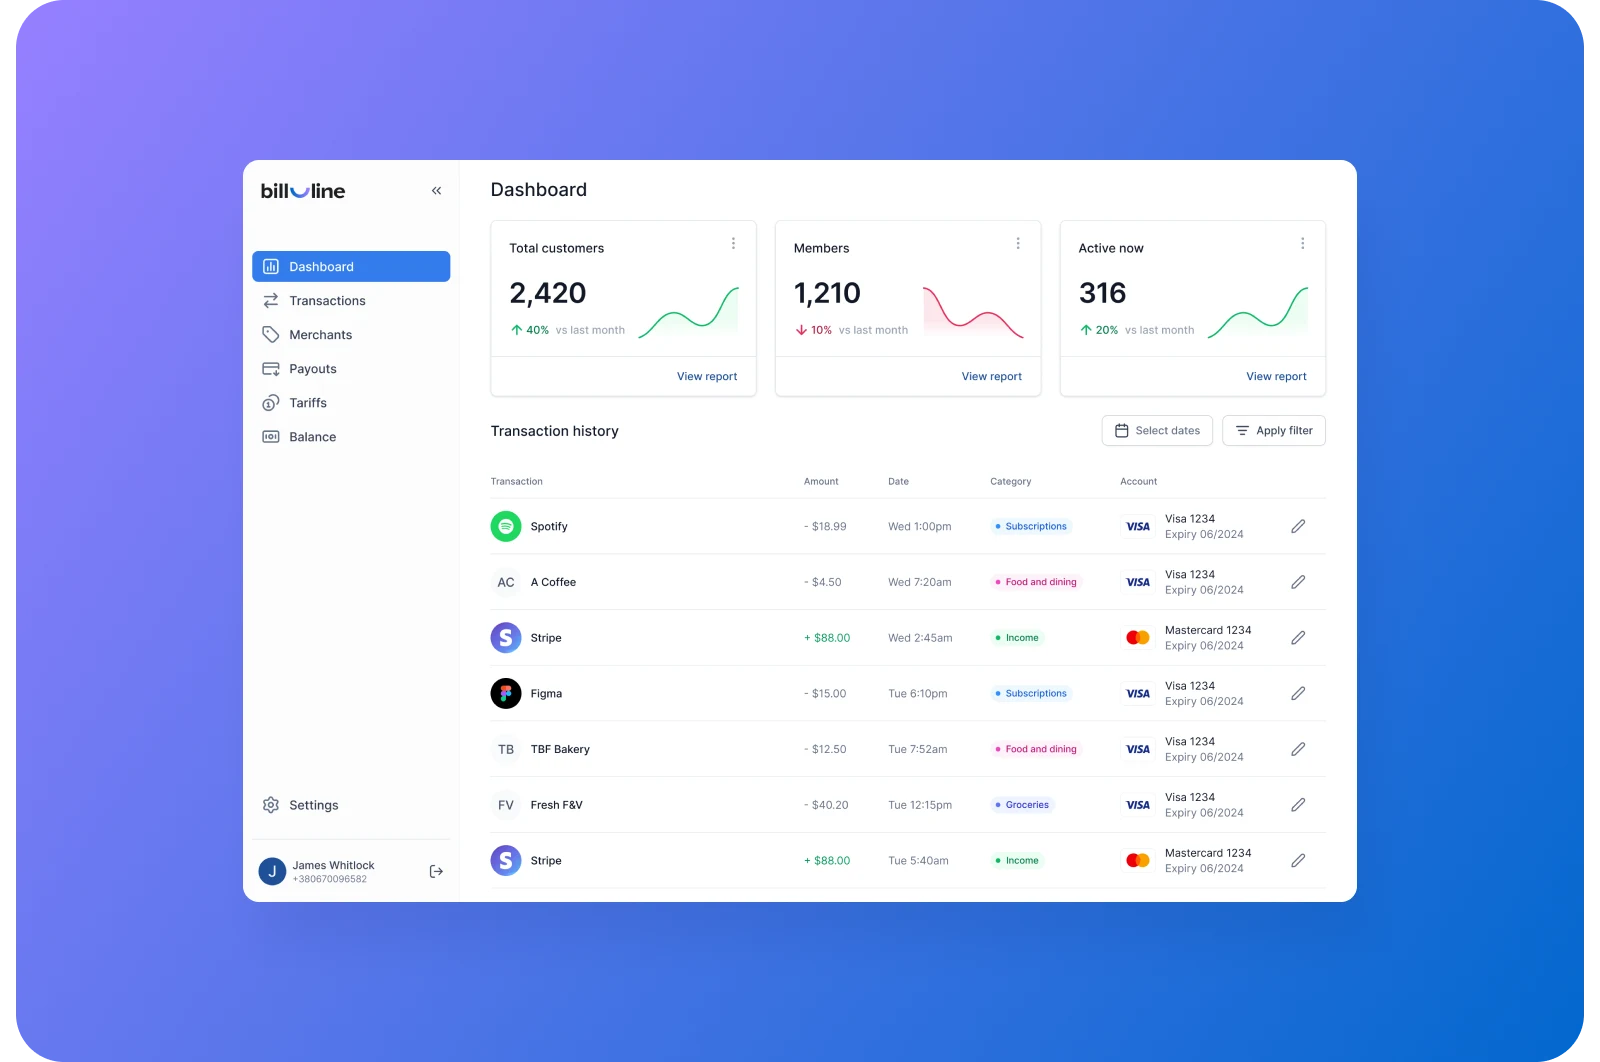
A little breakdown of what’s inside:
- Three stat cards (Total Customers, Members, Active Now) with embedded sparklines — the same percentage delta tells a different story depending on the line shape behind it.
- "View report" drill-down link on each card, keeping exploration one click away without breaking the primary view.
- Transaction history table with color-coded amounts (red for debit, green for income) and category badges scannable by color before the label is read.
- Flat six-item sidebar navigation — no nested menus, no ambiguous icons, active state clear at a glance.
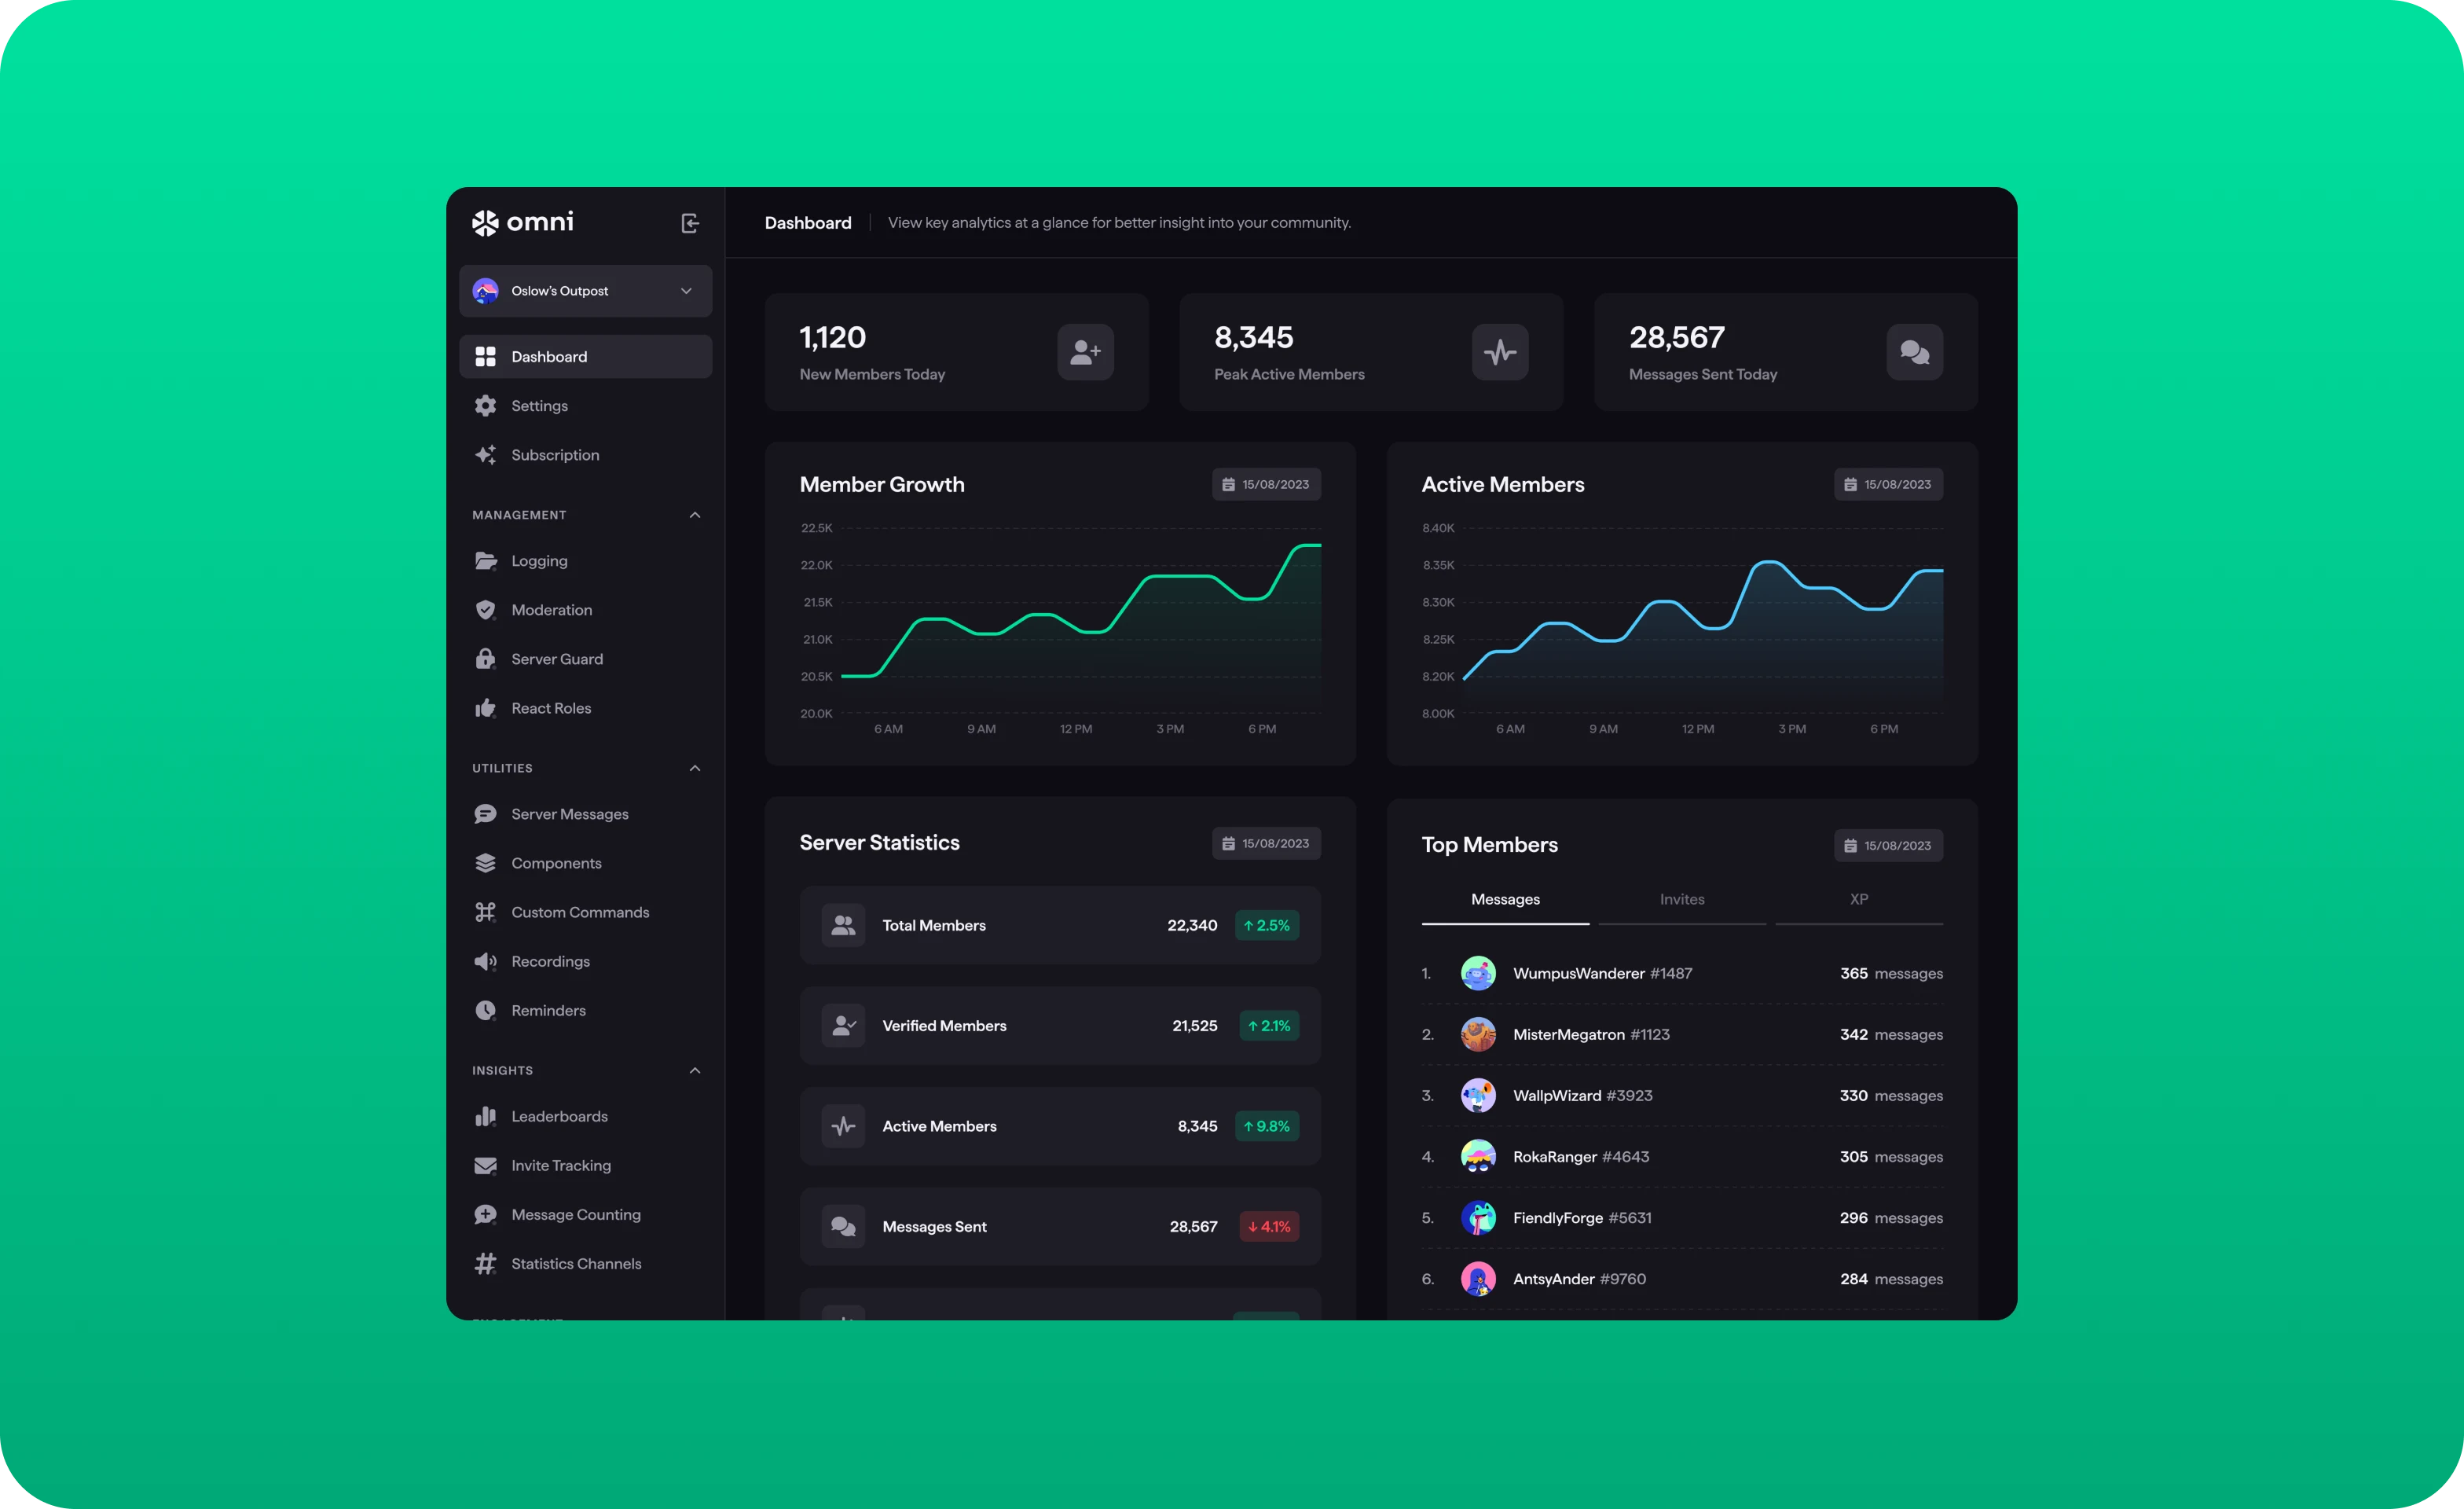
Omni — Discord community analytics dashboard
Omni is a Discord community management platform. Server owners and community managers need to know whether their community is growing, how engaged members are, and who's driving activity — all without leaving the main view.
Read the full Omni case study
A little breakdown of what’s inside:
- Three stat cards (New Members Today, Peak Active Members, Messages Sent Today) with icon-based categorization — row scannable by shape before the numbers register.
- Member Growth and Active Members charts share an identical time axis side by side — comparison between growth and engagement peaks requires zero analytical effort.
- Server Statistics list with inline color-coded percentage badges — health status is readable before a single number is processed.
- Top Members panel with tabbed switching (Messages / Invites / XP) — same interface, different contribution lens, no navigation required.
- Sidebar organized into three labeled intent zones: Management, Utilities, Insights — deep functionality without depth confusion.
Lead your dashboard to change user behavior
We work with SaaS teams from early product definition through launch and iteration. Dashboard UX is where we see the most consistent gap between what teams ship and what users actually need.
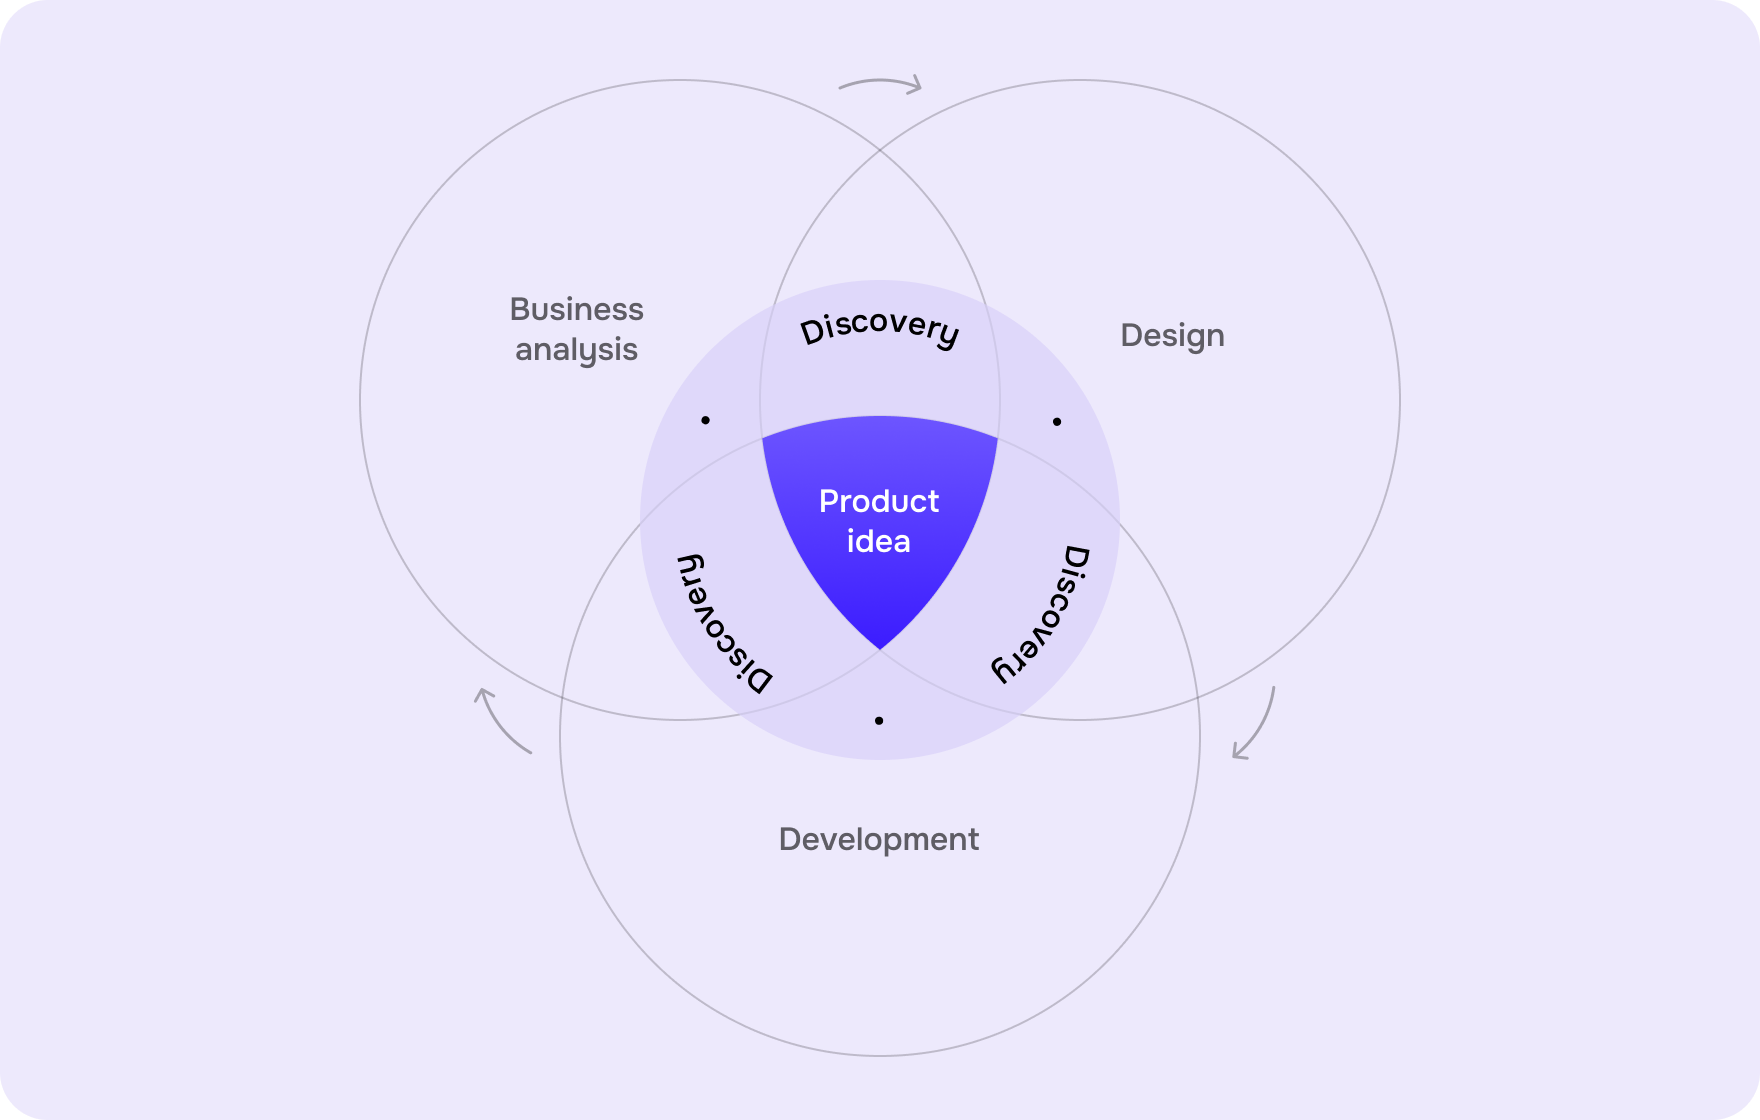
Our process starts with decision mapping — understanding what questions different user roles are trying to answer, and building information architecture around those questions rather than the data model. We prototype in low fidelity, test with real users early, and refine before writing a prod code.
If your dashboard is underperforming, we can audit what's broken and rebuild it to meet your unique needs. Let's talk and create the best product experience for you.
FAQ
What makes a SaaS dashboard effective?
An effective SaaS dashboard answers a specific user's question as quickly as possible. That means a clear visual hierarchy, metrics with built-in context, role-appropriate defaults, and a load sequence that prioritizes the most critical data. The test isn't how much a dashboard shows — it's how quickly a user can act on what they see.
How many metrics should a SaaS dashboard display?
Fewer than most teams want to ship. A primary view should carry 2–4 key metrics — the numbers that change behavior when they move. Secondary charts and breakdowns support those metrics but don't compete with them. If every metric looks equally important, none of them are. The discipline is deciding what belongs above the fold and having the confidence to move everything else down or out.
What's the difference between a dashboard and a report?
A report is pulled when someone needs to investigate something. A dashboard is always on — it's the screen users land on to get their bearings and decide what to do next. Reports answer "what happened and why." Dashboards answer "what should I pay attention to right now?" Designing a dashboard like a report — dense, comprehensive, built for analysis — is one of the most common reasons dashboards go unused.
Should every user role have a separate dashboard?
In most B2B SaaS products, yes. An executive checking pipeline health, a manager tracking team performance, and an operator monitoring live activity have different questions, different tolerances for complexity, and different definitions of "urgent." A single dashboard that tries to serve all three simultaneously usually ends up as a compromise that satisfies none of them. Role-based defaults with optional customization are the pattern that holds up best across product types.
How do you design a dashboard for a product with no data yet?
The empty state is a design-only problem. A new user landing on a blank dashboard needs to understand three things immediately: what this view will show once populated, what action they need to take to get there, and roughly how long that will take. An illustrated preview of the populated state, a single primary CTA, and a plain-language explanation of how data builds over time consistently outperform screens that simply say "No data yet.”
When should a SaaS dashboard use charts versus numbers?
Use a number when the value itself is the insight. Use a chart when the shape — the trend, the distribution, the comparison — is what matters. A chart that could be replaced by a single stat card probably should be. Charts are expensive real estate: they take longer to read, require more explanation, and can obscure a simple truth that a well-contextualized number would convey more quickly. Every visualization on a dashboard should earn its space by answering a question that a number alone can’t.
How does dashboard performance affect user behavior?
Significantly. Users form an impression of a product's reliability within the first few seconds of using it, and a slow or incomplete load is read as instability — even if the data is accurate. Beyond trust, slow load times correlate directly with higher bounce rates from primary views. Designing for perceived performance — skeleton states, priority-ordered loading, component-level error messages — consistently improves engagement metrics without requiring backend changes.
Read more
product experience

for your project
get in touch
Fill out the form
or brief with questions

PRIVACY POLICY
Welcome to Goodface privacy notice.
Goodface respects your privacy and is committed to protecting your personal data. This privacy notice will inform you as to how we look after your personal data when you visit our website (regardless of where you visit it from) and other sites we own and operate. And tell you about your privacy rights and how the law protects you.
We may change the privacy policy from time to time to reflect changes to the products and services that we provide and how we process your personal data.
We will not share your information with any third party outside of our organization, other than as necessary to fulfil your request if any."
INFORMATION WE COLLECT
When you visit our website, our servers may automatically log the standard data provided by your web browser. This data is considered “non-identifying information”, as it does not personally identify you on its own. It may include:
- Your computer’s Internet Protocol (IP) address;
- Your browser type and version;
- The pages you visit;
- The time and date of your visi;
- The time spent on each page;
OTHER DETAILS
We may ask for personal information, such as your name and email address. This data is considered “identifying information”, as it can personally identify you. We only request personal information relevant to providing you with a service, and only use it to help provide or improve this service.
We collect information by fair and lawful means, with your knowledge and consent. We also let you know why we’re collecting it and how it will be used. You are free to refuse our request for this information, with the understanding that we may be unable to provide you with some of your desired services without it.
We will only process personal data and communicate with you if:
1. You have given us consent to the processing of your personal data and communicating for one or more specific purposes i.e. requesting products or services from us, downloading material or information from our website or submitting a contact us form.
2. Performance of a contract
3. Where we have a legitimate interest for contacting you in relation to our products and services
DATA PROCESSING AND STORAGE
We only retain personal information for as long as necessary to provide a service, or to improve our services in future. While we retain this data, we will protect it within commercially acceptable means to prevent loss and theft, as well as unauthorised access, disclosure, copying, use or modification. That said, we advise that no method of electronic transmission or storage is 100% secure, and cannot guarantee absolute data security.
Rights and choices of individuals:
- See what data we have about you, if any;
- Change/correct any data we have about you;
- Have us delete any data we have about you;
- See what security measures we apply to your data;
- Express any concern you have about our use of your data;
You may opt out of any future contacts from us at any time. You can do the following at any time by contacting us via the email address given on our website: goodface.agency

Got questions or want to discuss a project ?
?
Let's talk