

30+ branding statistics & trends for 2027: what to watch




30+ branding statistics for 2027 | 1:52
No time to read? Explore through headphones, speakers, or on the go.
TL;DR
Branding now reaches far beyond recognition. The latest research connects brand value, differentiation, trust, customer experience, loyalty, and design with measurable business outcomes.
The data also points to where branding decisions go wrong. Companies change identities without a clear business reason, treat consistency as a visual exercise, or measure brand performance separately from the customer and business results it should influence.
The strongest brand decisions start with the business problem. Build recognition before changing what customers know. Make differentiation visible across every touchpoint. Connect the brand promise to the product experience. And measure what changes after the work goes live.
Below, we bring together 30 core branding statistics for 2027 and the research behind them, followed by the branding trends we expect to shape the year.


How we selected these branding statistics
We selected 30 core branding statistics from primary sources and clearly documented industry research, including McKinsey, Gartner, Forrester, Deloitte, and Ipsos, and skipped anything vague, unsourced, or recycled from a generic roundup.
We prioritized named studies, recent research published or updated around 2026, and methodologies we could verify.
Some of the research behind these numbers predates 2027. We keep those findings where they provide useful context, but we label the original research period rather than presenting older benchmarks as current market data.
We also distinguish commissioned research from independent industry research. When a study comes from a vendor or was commissioned by a company, we identify that context so you can judge the finding accordingly.
The 30 statistics below form the core dataset for this article. Other figures — such as research sample sizes, market coverage, or supporting percentages — provide context but aren’t counted separately.
How to treat these figures
Statistics show patterns across markets and audiences. They don't predict what will happen to one company. Brand performance depends on the category, audience, business model, starting point, implementation, and the way results are measured. A strong result in one market does not automatically translate to the same result in another.
Use these numbers to frame a branding question. Then measure what changes in your own business — from recognition and consideration to conversion, retention, or revenue.
30 key branding statistics for 2027
| Category | Statistic | Source |
| 1. Brand ROI & Business Impact | $13.1T — combined value of the world's top 100 brands in 2026, up 22% YoY | Kantar BrandZ, 2026 |
| 2. Brand ROI & Business Impact | 5× faster — brand-value growth for Meaningfully Different brands | Kantar, 2026 |
| 3. Brand ROI & Business Impact | 2× more likely — companies with a strong brand strategy are to exceed their organizational growth targets | Gartner, 2026 |
| 4. Brand ROI & Business Impact | $4T+ — combined value of the top 300 B2B brands | Brand Finance, 2026 |
| 5. Brand ROI & Business Impact | $10.4T — combined value of the world's 500 most valuable brands, up 11% | Brand Finance, 2026 |
| 6. Brand ROI & Business Impact | 32 pp higher revenue growth + 56 pp higher shareholder returns — top-quartile design performers vs. industry peers | McKinsey Design Index |
| 7. Brand Consistency & Trust | 88% — consumers who consider trust an important or critical purchase criterion | Edelman Trust Barometer, 2026 |
| 8. Brand Consistency & Trust | 66% — consumers who hesitate or refuse to trust people they perceive as different from themselves | Edelman, 2026 |
| 9. Brand Consistency & Trust | ~2× — consumers are more likely to support brand expansion when the brand has both trust and relevance | Edelman, 2026 |
| 10. Brand Consistency & Trust | 3 in 10 — consumers who tell a business why they're leaving | Qualtrics, 2026 |
| 11. Brand Consistency & Trust | 30% — consumers who switch brands after one bad experience without explaining why | Qualtrics, 2026 |
| 12. Brand Recognition & Awareness | Significant effect — brand recognition and recall influence purchase decisions | Peer-reviewed study, 2026 |
| 13. Brand Recognition & Awareness | ~30% of revenue — approximate share associated with brand strength across categories | NIQ, 2026 |
| 14. Brand Recognition & Awareness | 40% — consumers who try a new product out of curiosity | NIQ, 2026 |
| 15. Brand Recognition & Awareness | Distinctive assets — colors, logos, shapes, and sounds build mental availability | Ehrenberg-Bass Institute |
| 16. Brand Recognition & Awareness | 50%+ — share of brand choice attributed to context in Ipsos research | Ipsos, The Context Advantage |
| 17. Emotional Connection & Customer Loyalty | 62% — consumers who feel an emotional connection to their go-to brands | McKinsey / BoF, 2026 |
| 18. Emotional Connection & Customer Loyalty | Up to 40% — perceived brand value linked to experience, quality, and loyalty programs | Deloitte, 2026 |
| 19. Emotional Connection & Customer Loyalty | 46% vs. 23% — consumers vs. executives who name product/service quality as their main loyalty driver | PwC |
| 20. Emotional Connection & Customer Loyalty | 88% + 77% — consumers who tried a new-to-them brand recently, while 77% shop with five brands or fewer regularly | Attentive, 2026 |
| 21. Brand Perception & Buying Decisions | 20× more likely — consumers than brands to say commerce experiences fall short of expectations | Deloitte, 2026 |
| 22. Brand Perception & Buying Decisions | 74% — consumers who would switch brands for lower regular prices | Capgemini, 2026 |
| 23. Brand Perception & Buying Decisions | 3.8× — reported revenue lift for US retailers with strong total experience | Forrester, 2026 |
| 24. Brand Perception & Buying Decisions | ~40% + 1.6× — B2B revenue and margin leaders citing brand perception as a key account-growth factor; clearly differentiated value propositions correlate with 1.6× faster growth | Bain & Company, 2026 |
| 25. Brand Perception & Buying Decisions | 81% — consumers who say reflecting their identity drives brand relevance | 2026 research cited in source |
| 26. Rebranding & Brand Refresh | 96% — global brands undergoing continuous transformation | WFA / Ogilvy Consulting, 2026 |
| 27. Rebranding & Brand Refresh | 80%+ — companies Gartner expects to make significant identity, mission, or culture changes by 2028 | Gartner, 2026 |
| 28. Rebranding & Brand Refresh | 84% — companies caught in Gartner's “brand doom loop” | Gartner, 2026 |
| 29. Rebranding & Brand Refresh | 76% — surveyed US consumers who preferred Cracker Barrel's old logo after its 2026 rebrand | YouGov, 2026 |
| 30. Rebranding & Brand Refresh | 98% — consumers who notice when a familiar brand changes its identity | Clutch |
Branding statistics by category
We grouped the data into six areas, so you can jump straight to the one that matches your problem — a shrinking ad budget, a stalled rebrand, or a logo nobody remembers.
1. Brand ROI & Business Impact
Money follows brand strength, and the data backs that up with hard figures instead of guesswork.
Global brand value hits $13.1 trillion
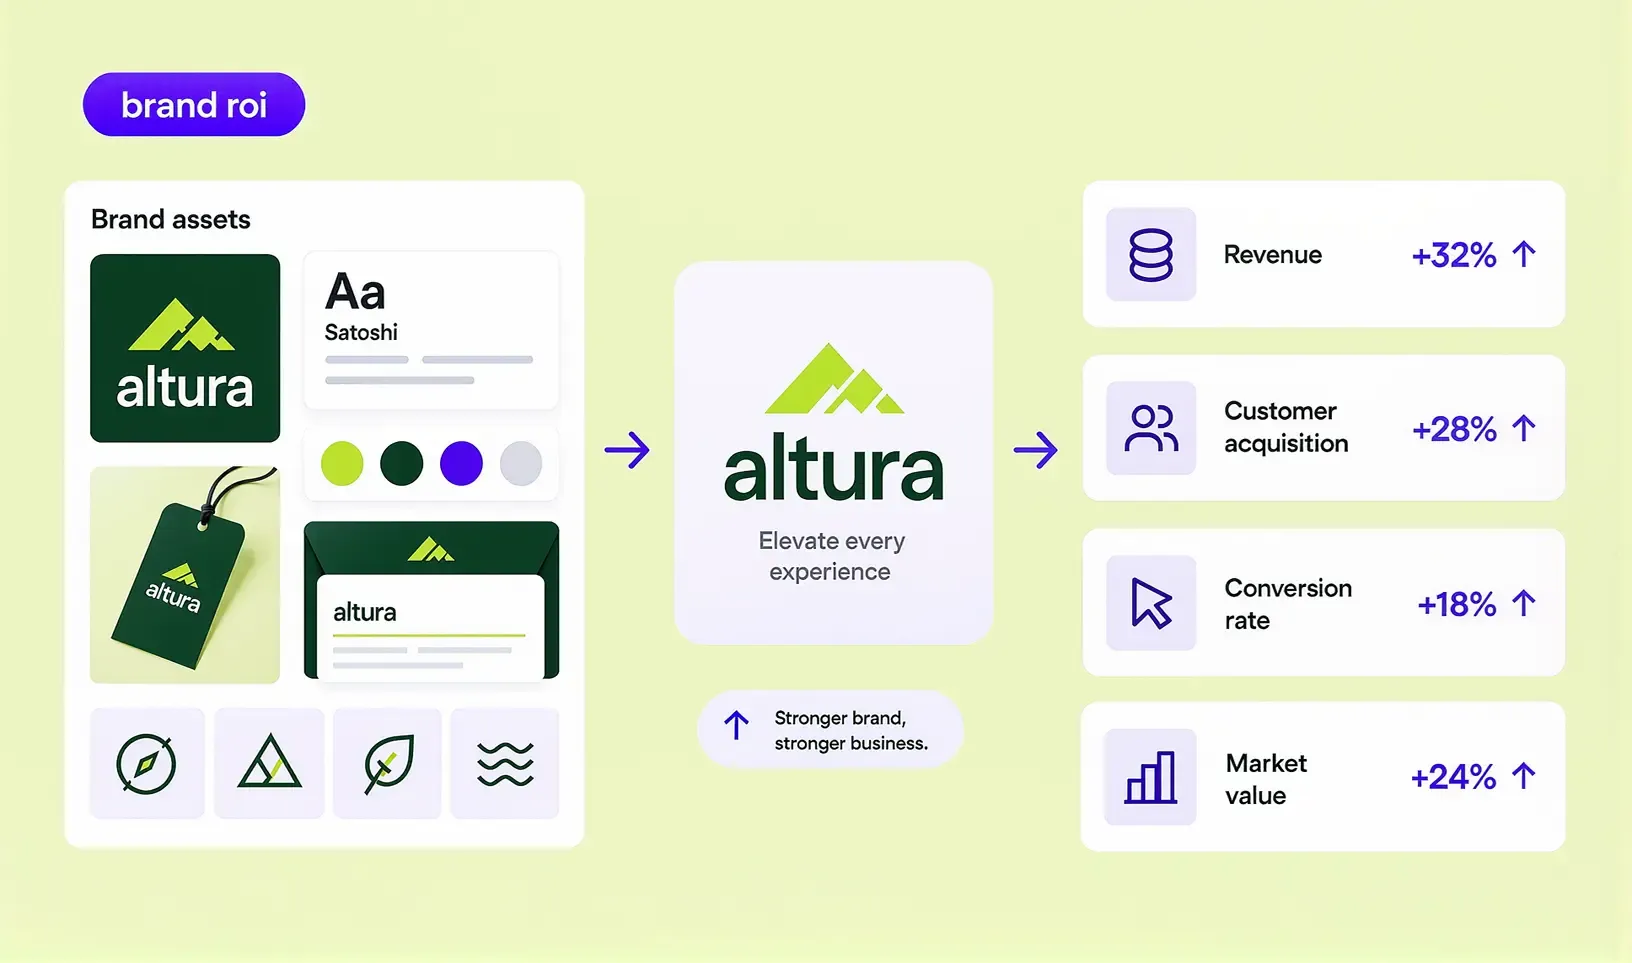
The Kantar BrandZ Global Top 100 reached $13.1 trillion in combined brand value in 2026, up 22% year over year. Kantar built the ranking on 4.6 million consumer interviews across 22,392 brands in 54 markets.
Meaningful and unique brands grow 5x faster
Brands that stand out as Meaningfully Different grow brand value five times faster than brands that don't. Kantar ties this lift directly to three levers: meaningfulness, difference, and salience.
Brand strategy makes difference
Gartner's 2026 research found that companies with a strong brand strategy were twice as likely to exceed their organizational growth targets.
B2B brands hold $4 trillion in value
The top 300 B2B brands hold more than $4 trillion in combined brand value. Brand Finance puts brand at 11% of total business value for B2B companies, on average.
World's top 500 brands reach $10.4 trillion
The world's 500 most valuable brands grew their combined value 11% to $10.4 trillion in 2026. Brand Finance's Global 500 puts Apple at $607.6 billion, Microsoft at $565.2 billion, and Google at $433.1 billion.
Top design performers beat peers 2-to-1
McKinsey's Design Index tracked 300 public companies over five years and found top-quartile design performers posted 32 percentage points higher revenue growth and 56 percentage points higher returns to shareholders than their industry peers.
The pattern holds across industries. Companies that build brand as infrastructure grow faster than companies that treat it as decoration.
Revenue growth follows a full system: consistent visuals, one repeated message, and a product experience that backs up both.
2. Brand Consistency & Trust
Brand consistency statistics show a direct line between how a brand looks and how much customers trust it.
Trust now rivals quality as a purchase driver
88% of consumers call trust an important or critical purchase criterion in 2026 — almost equal to quality at 89% and value at 88%.
Two-thirds of consumers hesitate to trust difference
66% of consumers hesitate or refuse to trust someone different from them. Of that group, 30% won't use brands favored by people unlike them.
Trust plus relevance nearly doubles support for expansion
Consumers back a brand's move into new audiences almost twice as often when that brand has earned both trust and relevance. Edelman's 2026 research names trust and relevance as a core condition for brand growth.
Most customers leave without saying why
Only 3 in 10 consumers tell a business why they're leaving. Qualtrics found more customers walk away silently, which makes consistent experience harder to track.
Nearly half of buyers switch brands without a word
30% of consumers switch brands after one bad experience and never explain why. A broken experience can damage the relationship without ever showing up as a complaint.
Consistency turns a one-time buyer into a repeat customer. Every touchpoint confirms the same promise instead of raising new questions.
Need a more consistent brand? Let’s discuss your product's branding.
3. Brand Recognition & Awareness
Brand recognition statistics and brand awareness statistics both point to the same lever: visual memory beats verbal memory almost every time.
Recognition and recall drive buying behavior
A 2026 peer-reviewed study found brand recognition and recall significantly shape buying behavior. Researchers linked social-media activity, recognition, and recall to purchase decisions, drawing a clear line between simply being seen and actually being remembered.
Brand strength drives 30% of revenue
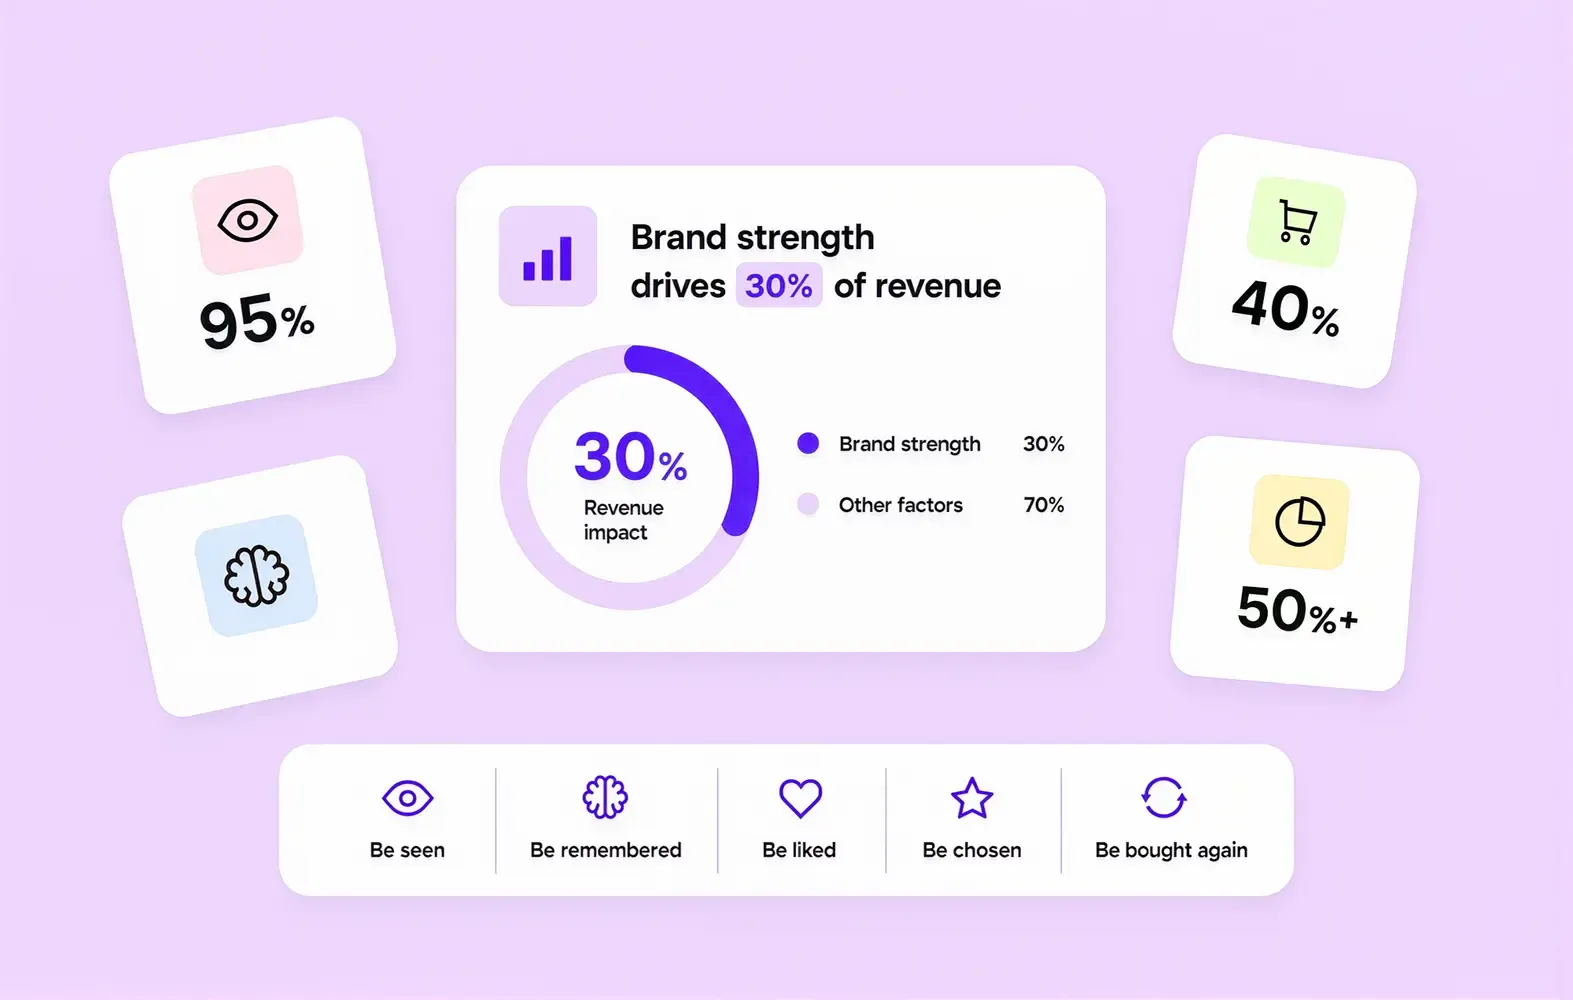
NIQ's 2026 brand-equity research puts brand strength behind about 30% of revenue across categories. NIQ measures brand strength through consumer appeal and pricing power, linking awareness directly to commercial performance.
Satisfaction beats novelty for repeat purchases
NIQ's 2026 data ranks liking, perceived quality, and value for money above novelty as predictors of repurchase. 40% of consumers try a new product out of curiosity, but satisfaction decides what they buy next.
Distinctive assets build mental availability
The Ehrenberg-Bass Institute for Marketing Science tracks how distinctive, non-verbal assets — colors, logos, shapes, sounds — build mental availability: the odds a brand comes to mind at the moment of buying. It treats recognition of these cues as a measurable asset, so brands can audit and strengthen recall on data instead of instinct.
Context drives over half of brand choice
Ipsos's The Context Advantage argues that awareness-only funnel metrics miss most of what drives brand choice — context accounts for over 50% of it. Recognition still matters, but Ipsos's data treats it as necessary, not sufficient.
A “logo” carries more brand memory than any single ad. Design it once, apply it everywhere, and recognition compounds with every impression.
4. Emotional Connection & Customer Loyalty
Numbers on feelings still count as data, and the research on emotional branding strategy runs deep.
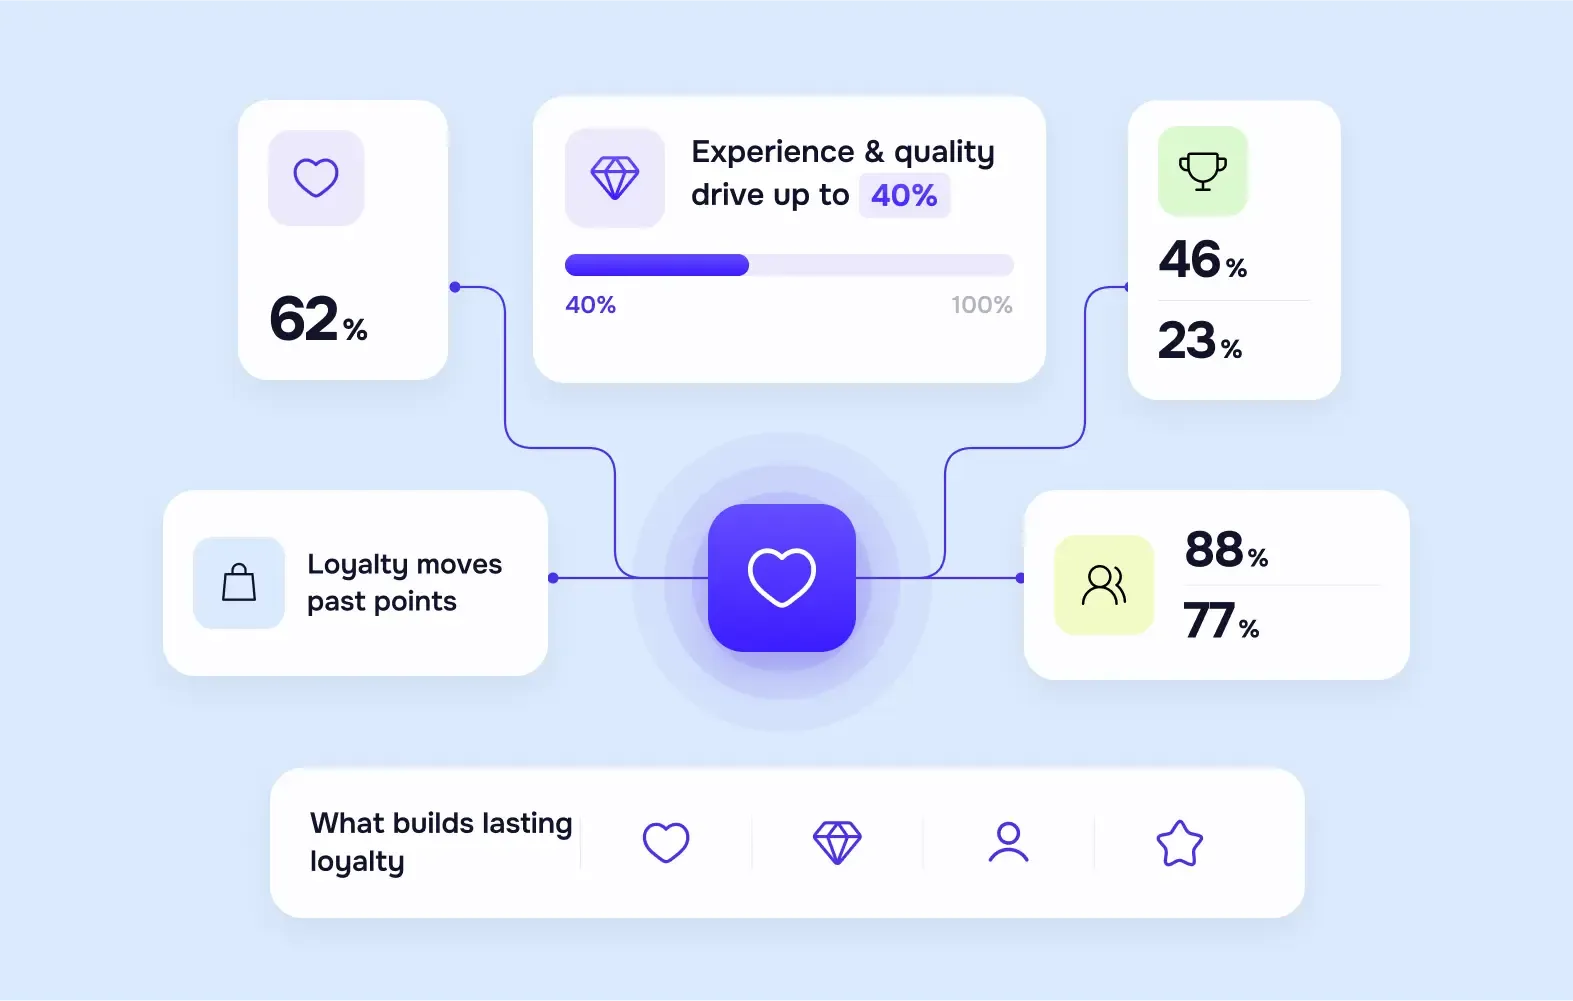
62% feel an emotional connection to their go-to brands
The figure comes from the 2026 State of Fashion survey by BoF and McKinsey, covering the US, UK, and China.
Experience and quality drive up to 40% of perceived value
Deloitte's latest loyalty research traces up to 40% of perceived brand value to experience, quality, and loyalty programs.
Executives underrate quality as a loyalty driver
PwC found 46% of consumers name product or service quality as their main loyalty driver — only 23% of executives agree.
Loyalty moves past points programs
McKinsey's 2026 Australian Consumer Loyalty Survey polled more than 1,700 consumers across 11 industries. So how does branding help to maintain customer loyalty? It’s moving away from points-based programs toward everyday value, personalization, and relevance — with AI increasingly shaping how consumers pick a brand.
Consumers try new brands but keep a short list
88% of consumers bought from a new-to-them brand in the past three months, yet 77% shop with five brands or fewer regularly. Earning a spot on that short list takes real work.
What we see from these stats: design and copy that speak to identity build loyalty a discount code never will.
5. Brand Perception & Buying Decisions
Perception shapes the first three seconds of every purchase decision, well before a customer reads a single product spec.
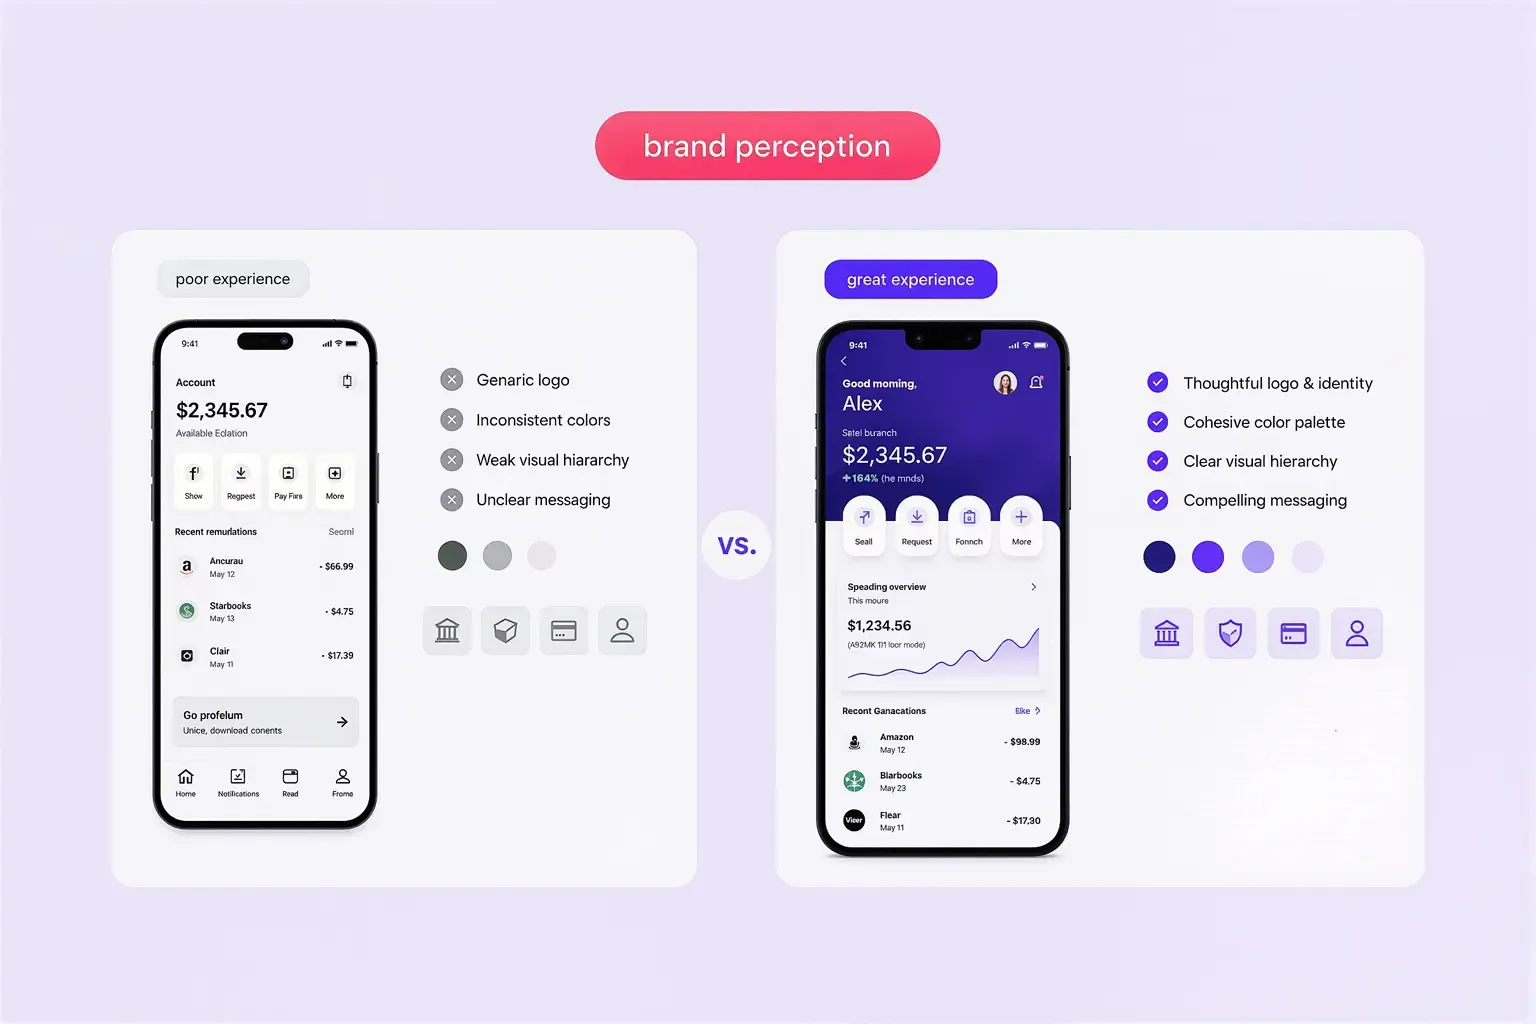
Consumers see a bigger experience gap than brands do
Deloitte's 2026 B2C commerce research found consumers are 20x more likely than brands to say commerce experiences fall short of their expectations.
Price still moves 74% of consumers
74% of consumers would switch brands for lower regular prices, per Capgemini Research Institute's 2026 study of 12,000 consumers across 12 countries.
Total experience multiplies revenue
Strong brand paired with strong customer experience drives outsized commercial returns. Forrester's 2026 Total Experience research found US companies with strong total experience posted a 2.6x revenue lift in automotive and 3.8x in retail.
Brand perception wins B2B accounts
Bain & Company's 2026 B2B Growth Agenda report found nearly 40% of revenue and margin leaders name brand perception a top factor in winning, keeping, or growing customer accounts. Only 4% feel confident in a clearly differentiated value proposition — even though that confidence links to 1.6x faster growth.
Identity and community fuel brand relevance
81% say a brand's ability to reflect their identity drives its relevance; 77% say the same for community connection.
Buyers judge a company on how it looks and what it stands for before they judge what it sells. That order rarely reverses.
6. Rebranding & Brand Refresh
Not every company needs a rebrand, but the data shows when the risk pays off and when it backfires.
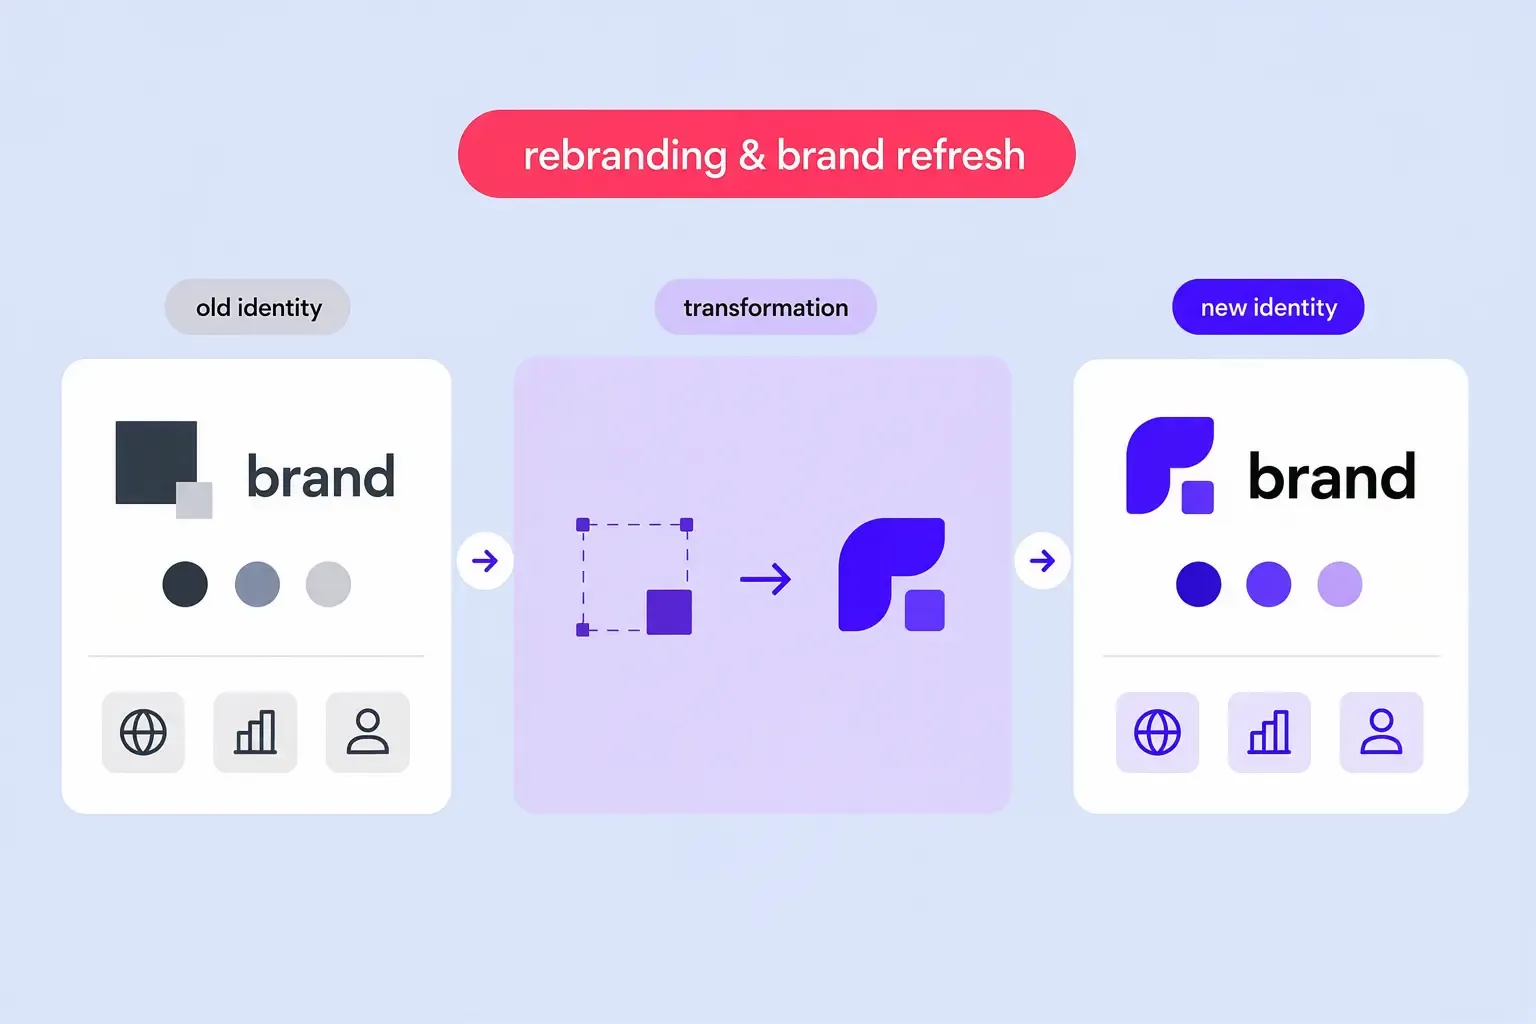
96% of brands are transforming right now
96% of global brands sit in continuous transformation today, per the 2026 WFA/Ogilvy Consulting Global Brand Transformation study. Researchers interviewed 80 senior marketers from 57 companies that together spend more than $60 billion on marketing each year.
80% of companies will rework identity by 2028
Gartner predicts more than 80% of companies will make significant changes to their identity, mission, or culture by 2028, driven by AI-fueled market disruption.
84% are stuck in the brand doom loop
84% of companies sit inside what Gartner calls a brand doom loop: underinvestment in brand measurement breeds uncertainty about brand impact, and that uncertainty makes the next investment harder to secure.
Cracker Barrel's logo change backfires with consumers
YouGov surveyed 1,002 U.S. adults on the Cracker Barrel logo change: 65% noticed it, 76% preferred the old design, and only 23% viewed the rebrand positively while 38% disliked it outright. Unlike broad rebrand-failure estimates, this case study is concrete and checkable.
98% of consumers notice a rebrand immediately
98% of consumers notice when a familiar brand changes its identity, per Clutch's research. Rebranding ranks among the most visible moves a company can make.
Five factors decide whether a rebrand works
A 2026 academic review of rebranding research names five factors that shape outcomes: consumer emotions, brand communication, corporate values, corporate strategy, and market conditions. A rebrand is a business decision, not a logo swap.
So which brands that need rebranding actually benefit from the move? The winners share one trait: they fix the product or the positioning first, then let the visual identity catch up. The companies that lose customers skip that step and launch a new look without a new reason behind it.
Need rebranding services? Contact us now.
How do these branding stats impact the business?
Put the branding facts side by side and a clear pattern emerges. The statistics point to a few decisions worth making before the next brand project.
Build consistency before you change the identity
Recognizable visual and verbal cues carry real weight with customers. Based on this, don’t change them drastically too often.
Audit how the current identity shows up across the website, product, sales materials, social channels, and customer communications. Fix what's already broken first; continue adding another visual layer later.
Connect the brand to the product experience
Trust, loyalty, and perceived value do not stop at the first impression. A strong identity can't carry a product experience that contradicts it.
Line up the brand promise, website, product interface, and customer communications so they tell one story.
Make differentiation visible
Kantar links meaningful difference to faster brand-value growth. Bain finds most B2B companies still doubt their own differentiation.
That gap creates an opportunity: define what sets the company apart, then build a visual and verbal system that makes that difference obvious.
Measure what changes
Brand measurement becomes especially important when the project involves a rebrand or major repositioning.
It needs a baseline first. Set it before you start. Then track the metrics tied to the original objective — recognition, consideration, conversion, retention, or customer response.
Branding insights from Goodface experts
We build brands for FinTech companies where trust decides the sale before a single feature gets discussed. Across our projects, we track how tone, color, and message consistency move conversion — and the data above matches what we see on the ground.
We design brand systems that hold together across a pitch deck, a product dashboard, and a support email, because brand demographics shift fast — a FinTech buyer in 2026 reads tone as a signal of technical competence, not just personality.
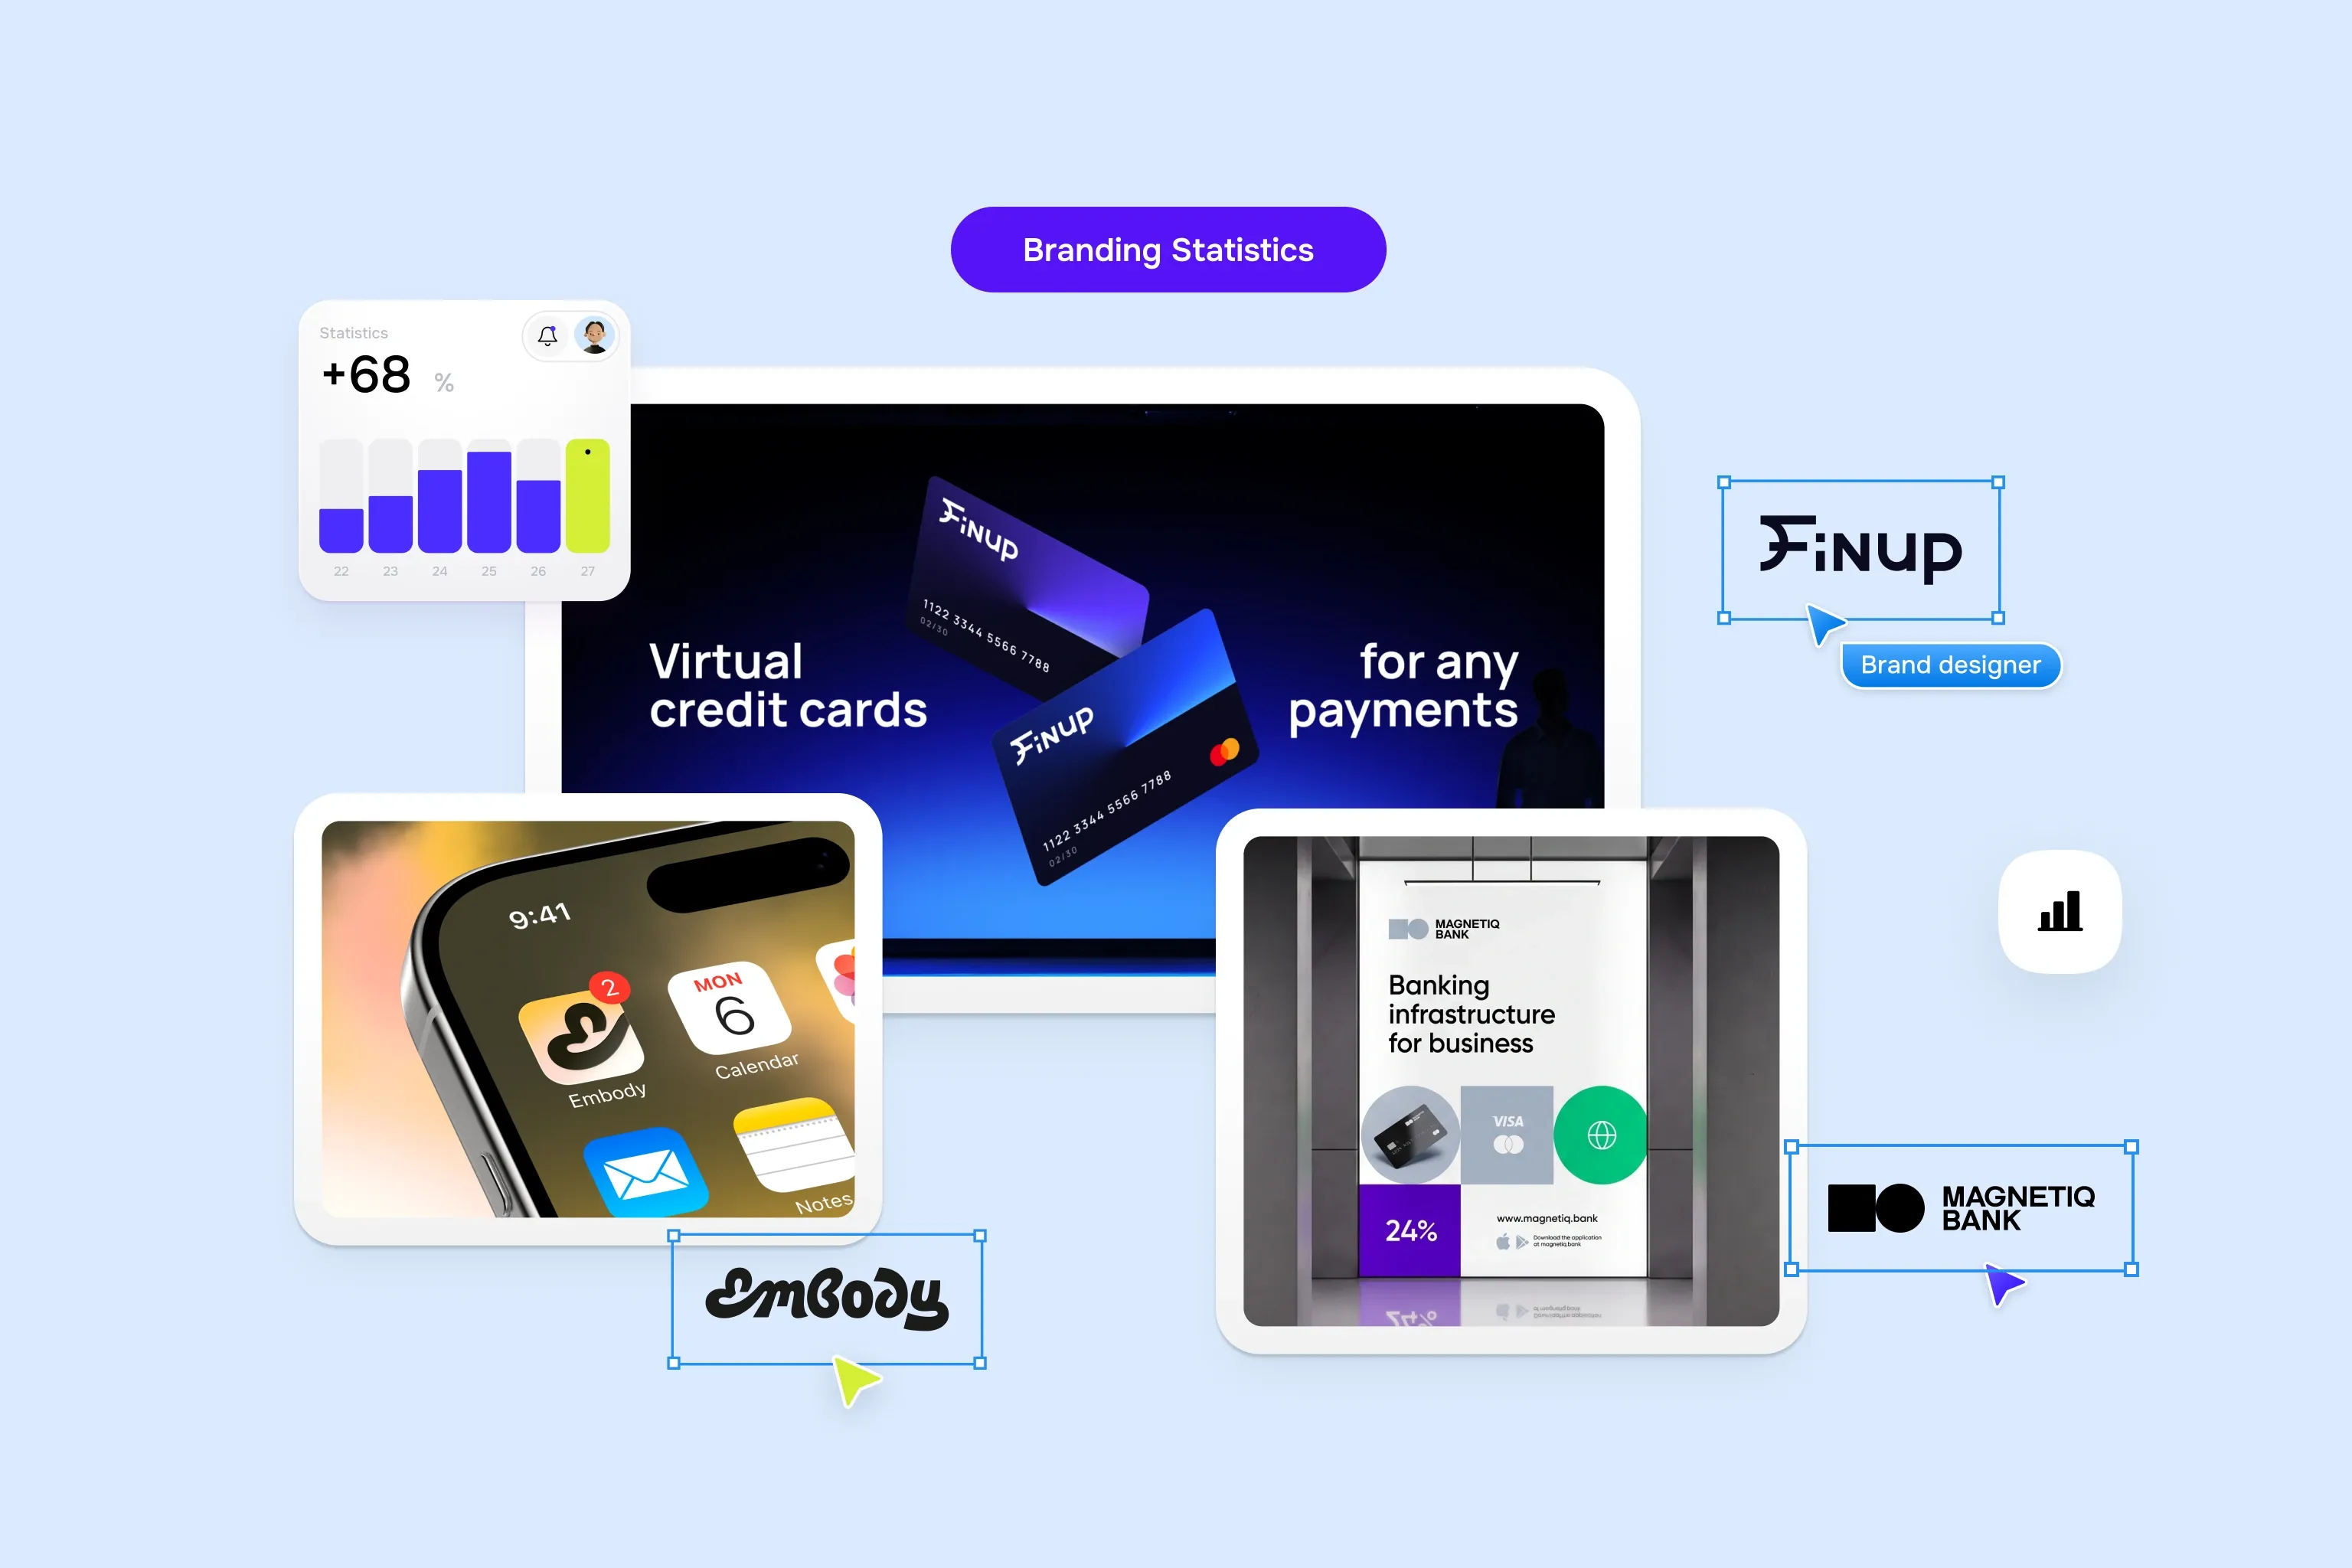
Brand identity work is useful when it changes how someone reads a company before they've used the product. We treat it as a reference point, then look at the actual market, the audience, and the credibility a company needs to earn. Our work with Magnetiq, Embody, and Finup is a good example.
Magnetiq Bank: rebranding for banking infrastructure
Magnetiq is a B2B fintech bank preparing to launch with a new name and a new promise: stronger collaboration between the bank and its clients. Before the rebrand, its identity didn’t yet support that promise across the brand — from the logo and design system to the digital experience.
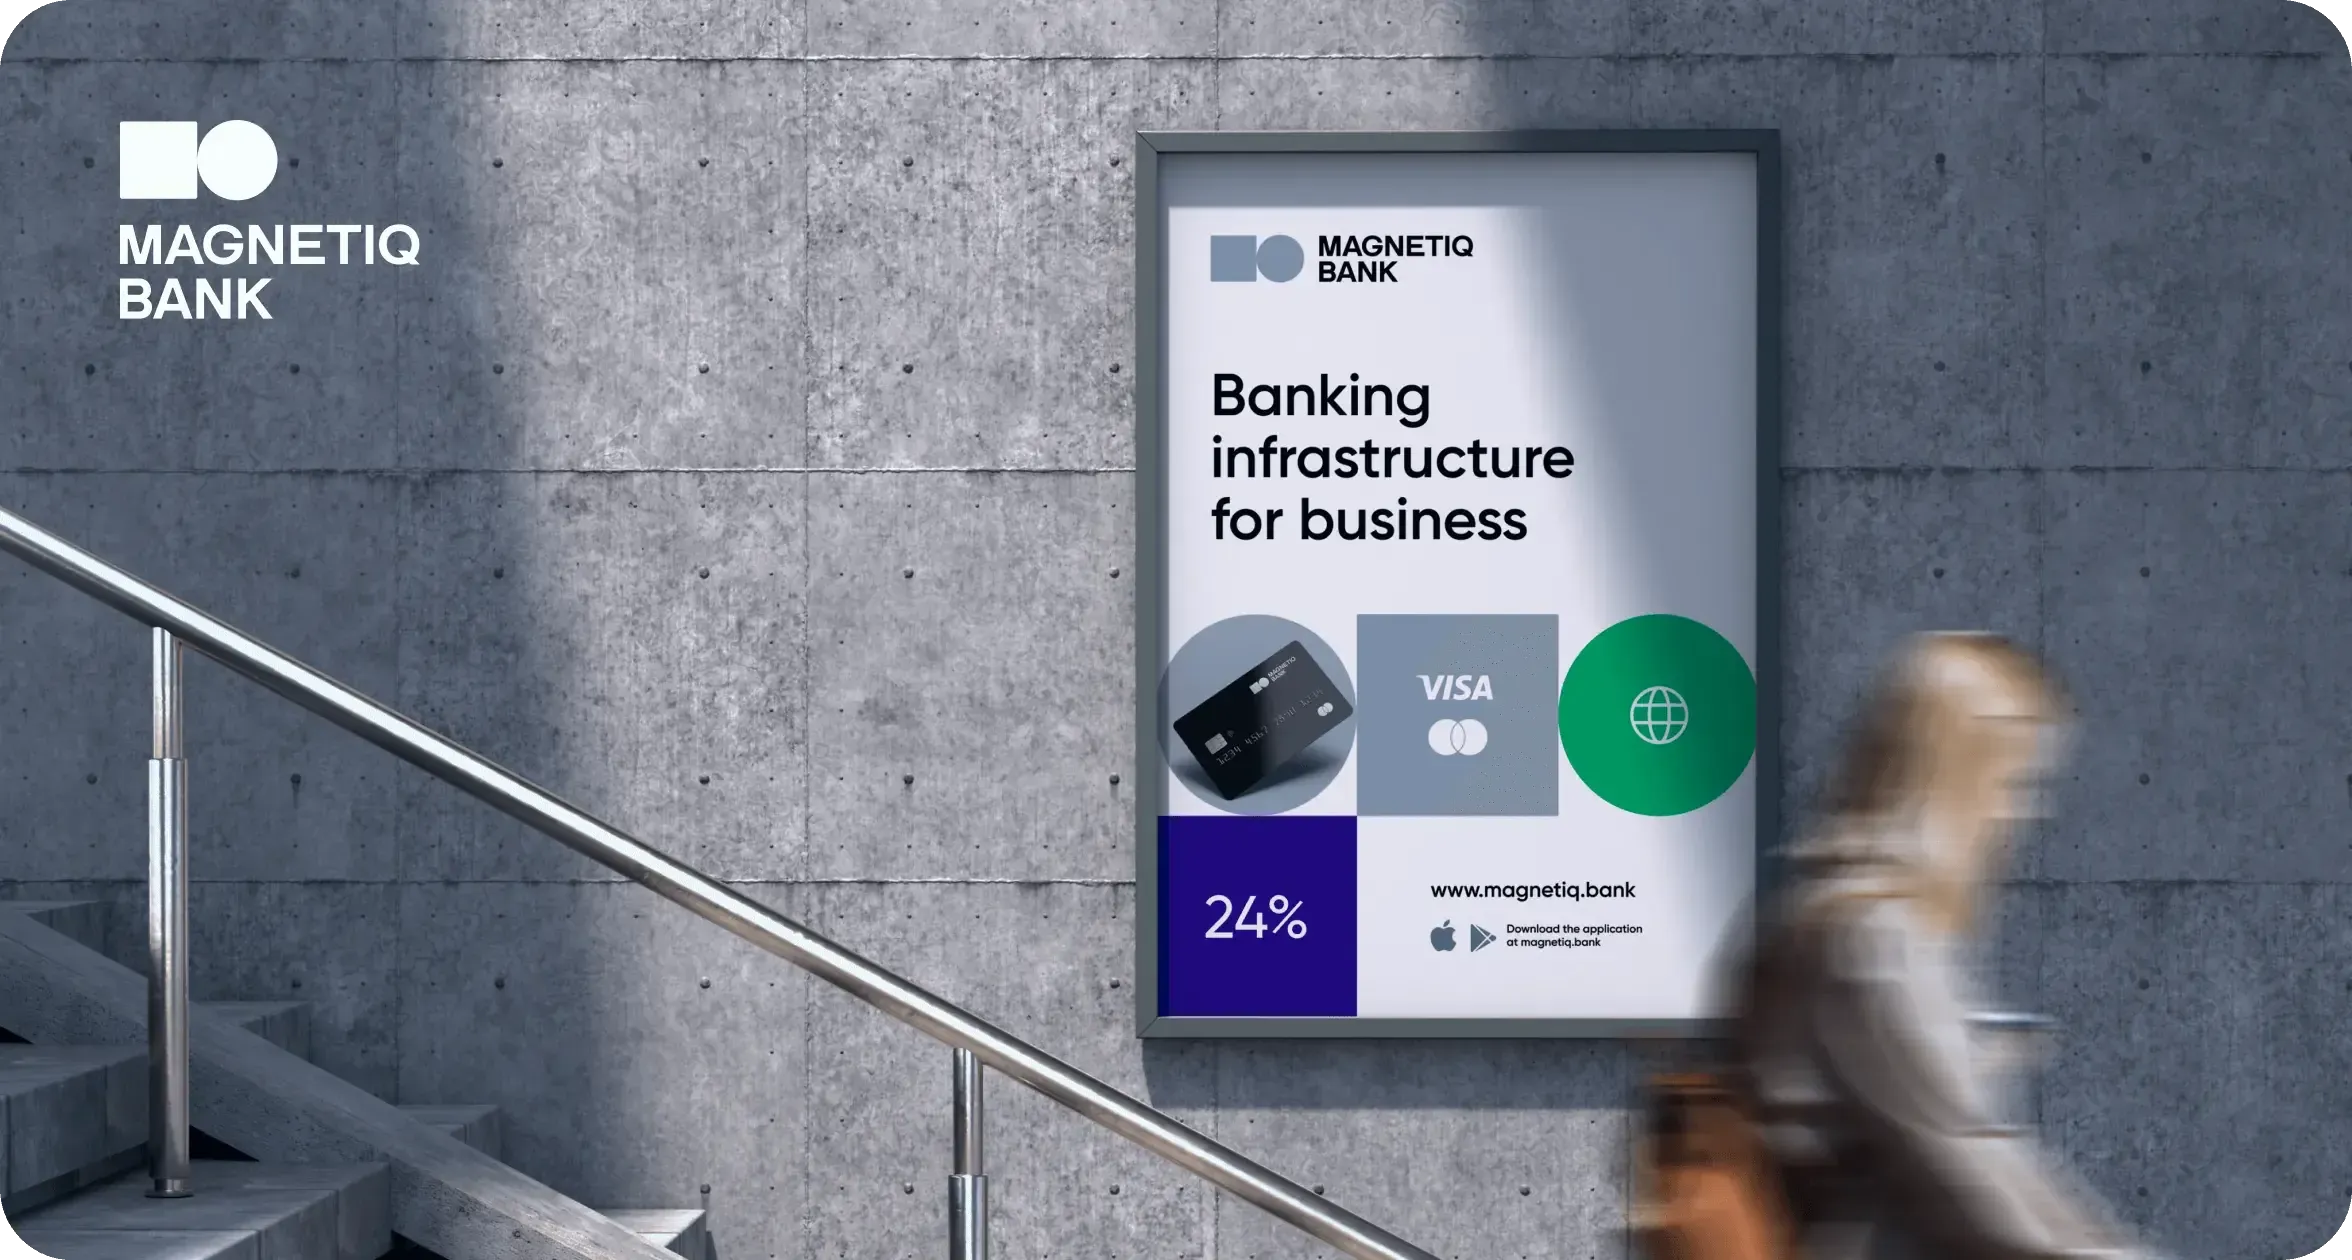
We developed brand consistency from scratch:
- creating a logo that joins a circle and a square into one mark, giving the idea of "power in collaboration" a physical shape;
- setting the visual foundation — colors, typography, and graphic elements — that would carry through every surface of the brand;
- building a full design system rather than a standard guideline, so the identity could scale across products;
- redesigning the digital experience end to end, from the public website to the interfaces people use inside the product.
Now, Magnetiq has one visual language running through the entire bank, from its logo to the tools clients use every day. For a B2B fintech, that consistency matters at every touchpoint. Magnetiq turned its identity into a system that carries the new positioning across the brand, product, and client experience.
Embody: building a wellness brand
Embody is a wellness brand for women who don't fit the mold of mainstream fitness. Its positioning called for a different kind of wellness: less pressure, more support, comfort, and care. The brand needed an identity that could carry that promise into something people recognize and feel at every touchpoint.
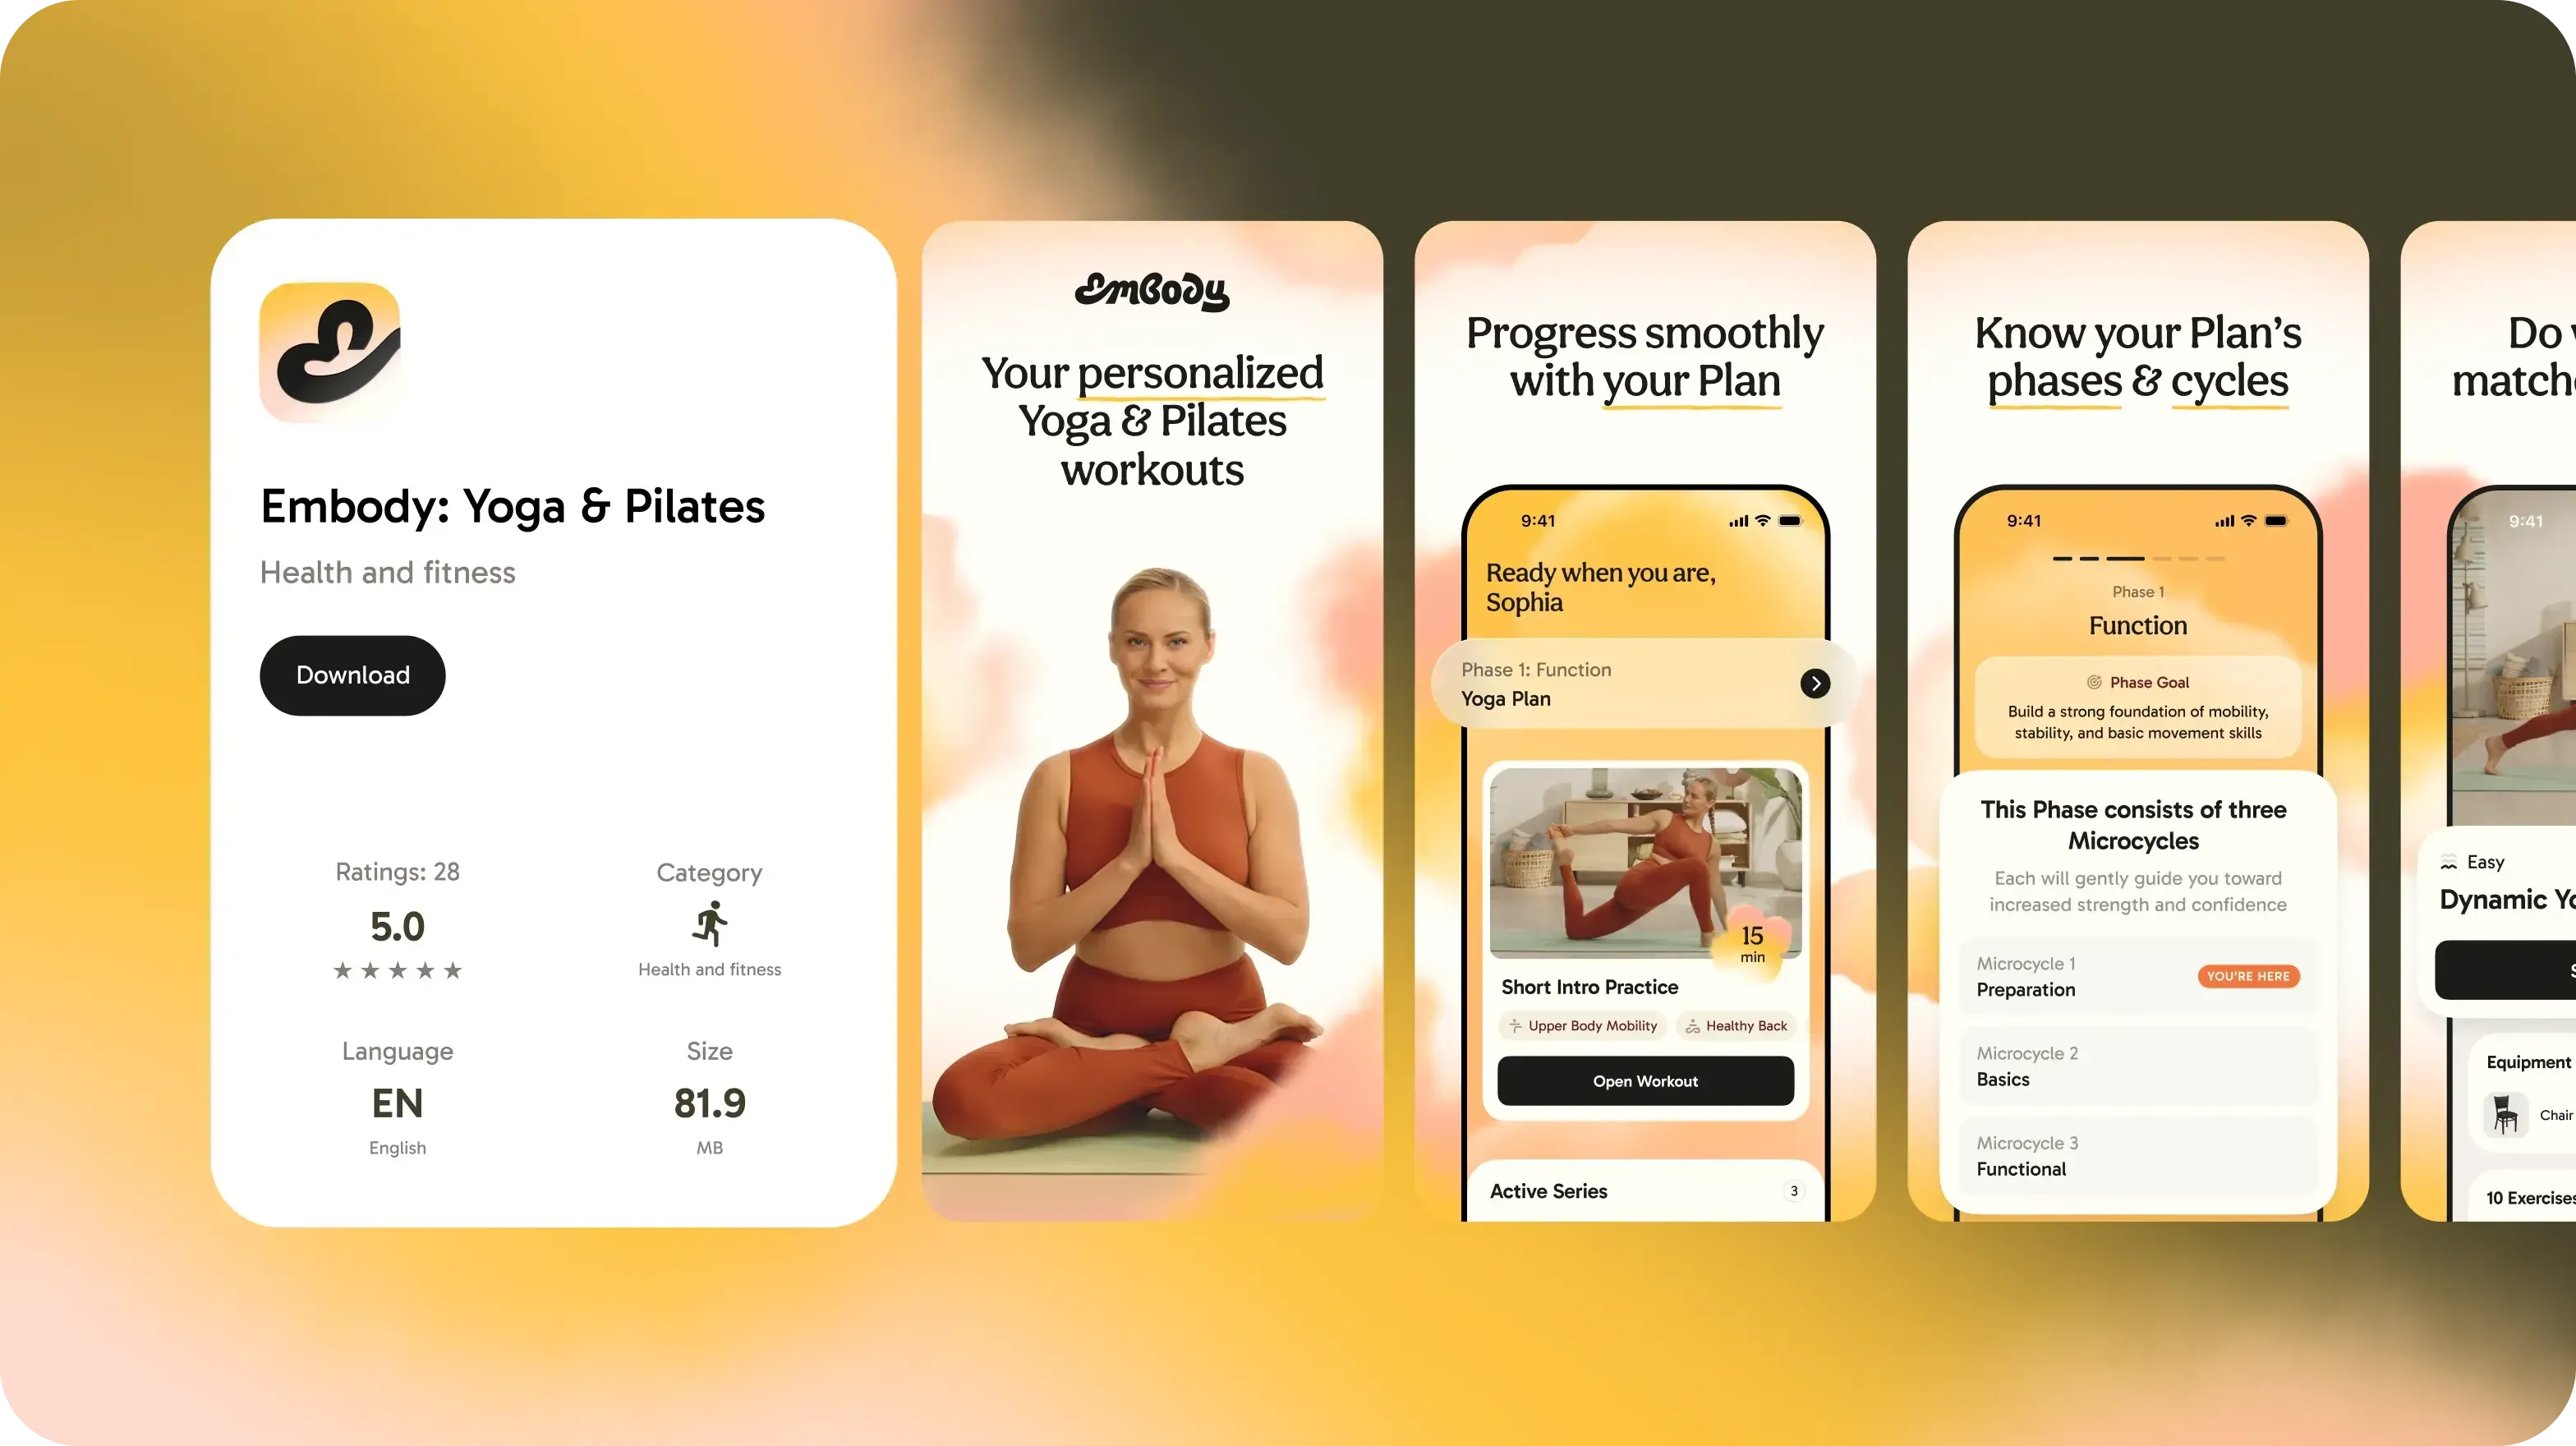
We designed the brand around emotional safety and consistency:
- building a calm visual identity with muted colors, clean typography, balanced illustrations, and hand-drawn graphic elements.
- translating Embody's gentle approach to wellness into a visual language people recognize on sight.
- architecting brand and design systems that scale with the product.
- carrying the identity across the mobile app, website, marketing materials, and every other touchpoint.
After our changes, Embody shows up the same way everywhere — app, website, marketing, every touchpoint aligned. The identity anchors the product in a clear emotional direction, setting Embody apart from performance-driven fitness brands while leaving the team room to grow what's next.
Finup: architecting a brand ready to go global
Finup is a fintech built around unlimited virtual cards, funded by both fiat and crypto. When we started the rebrand, the identity had a solid foundation but still felt regional. The company was preparing to enter new markets, but its identity and website weren’t ready for that next stage.
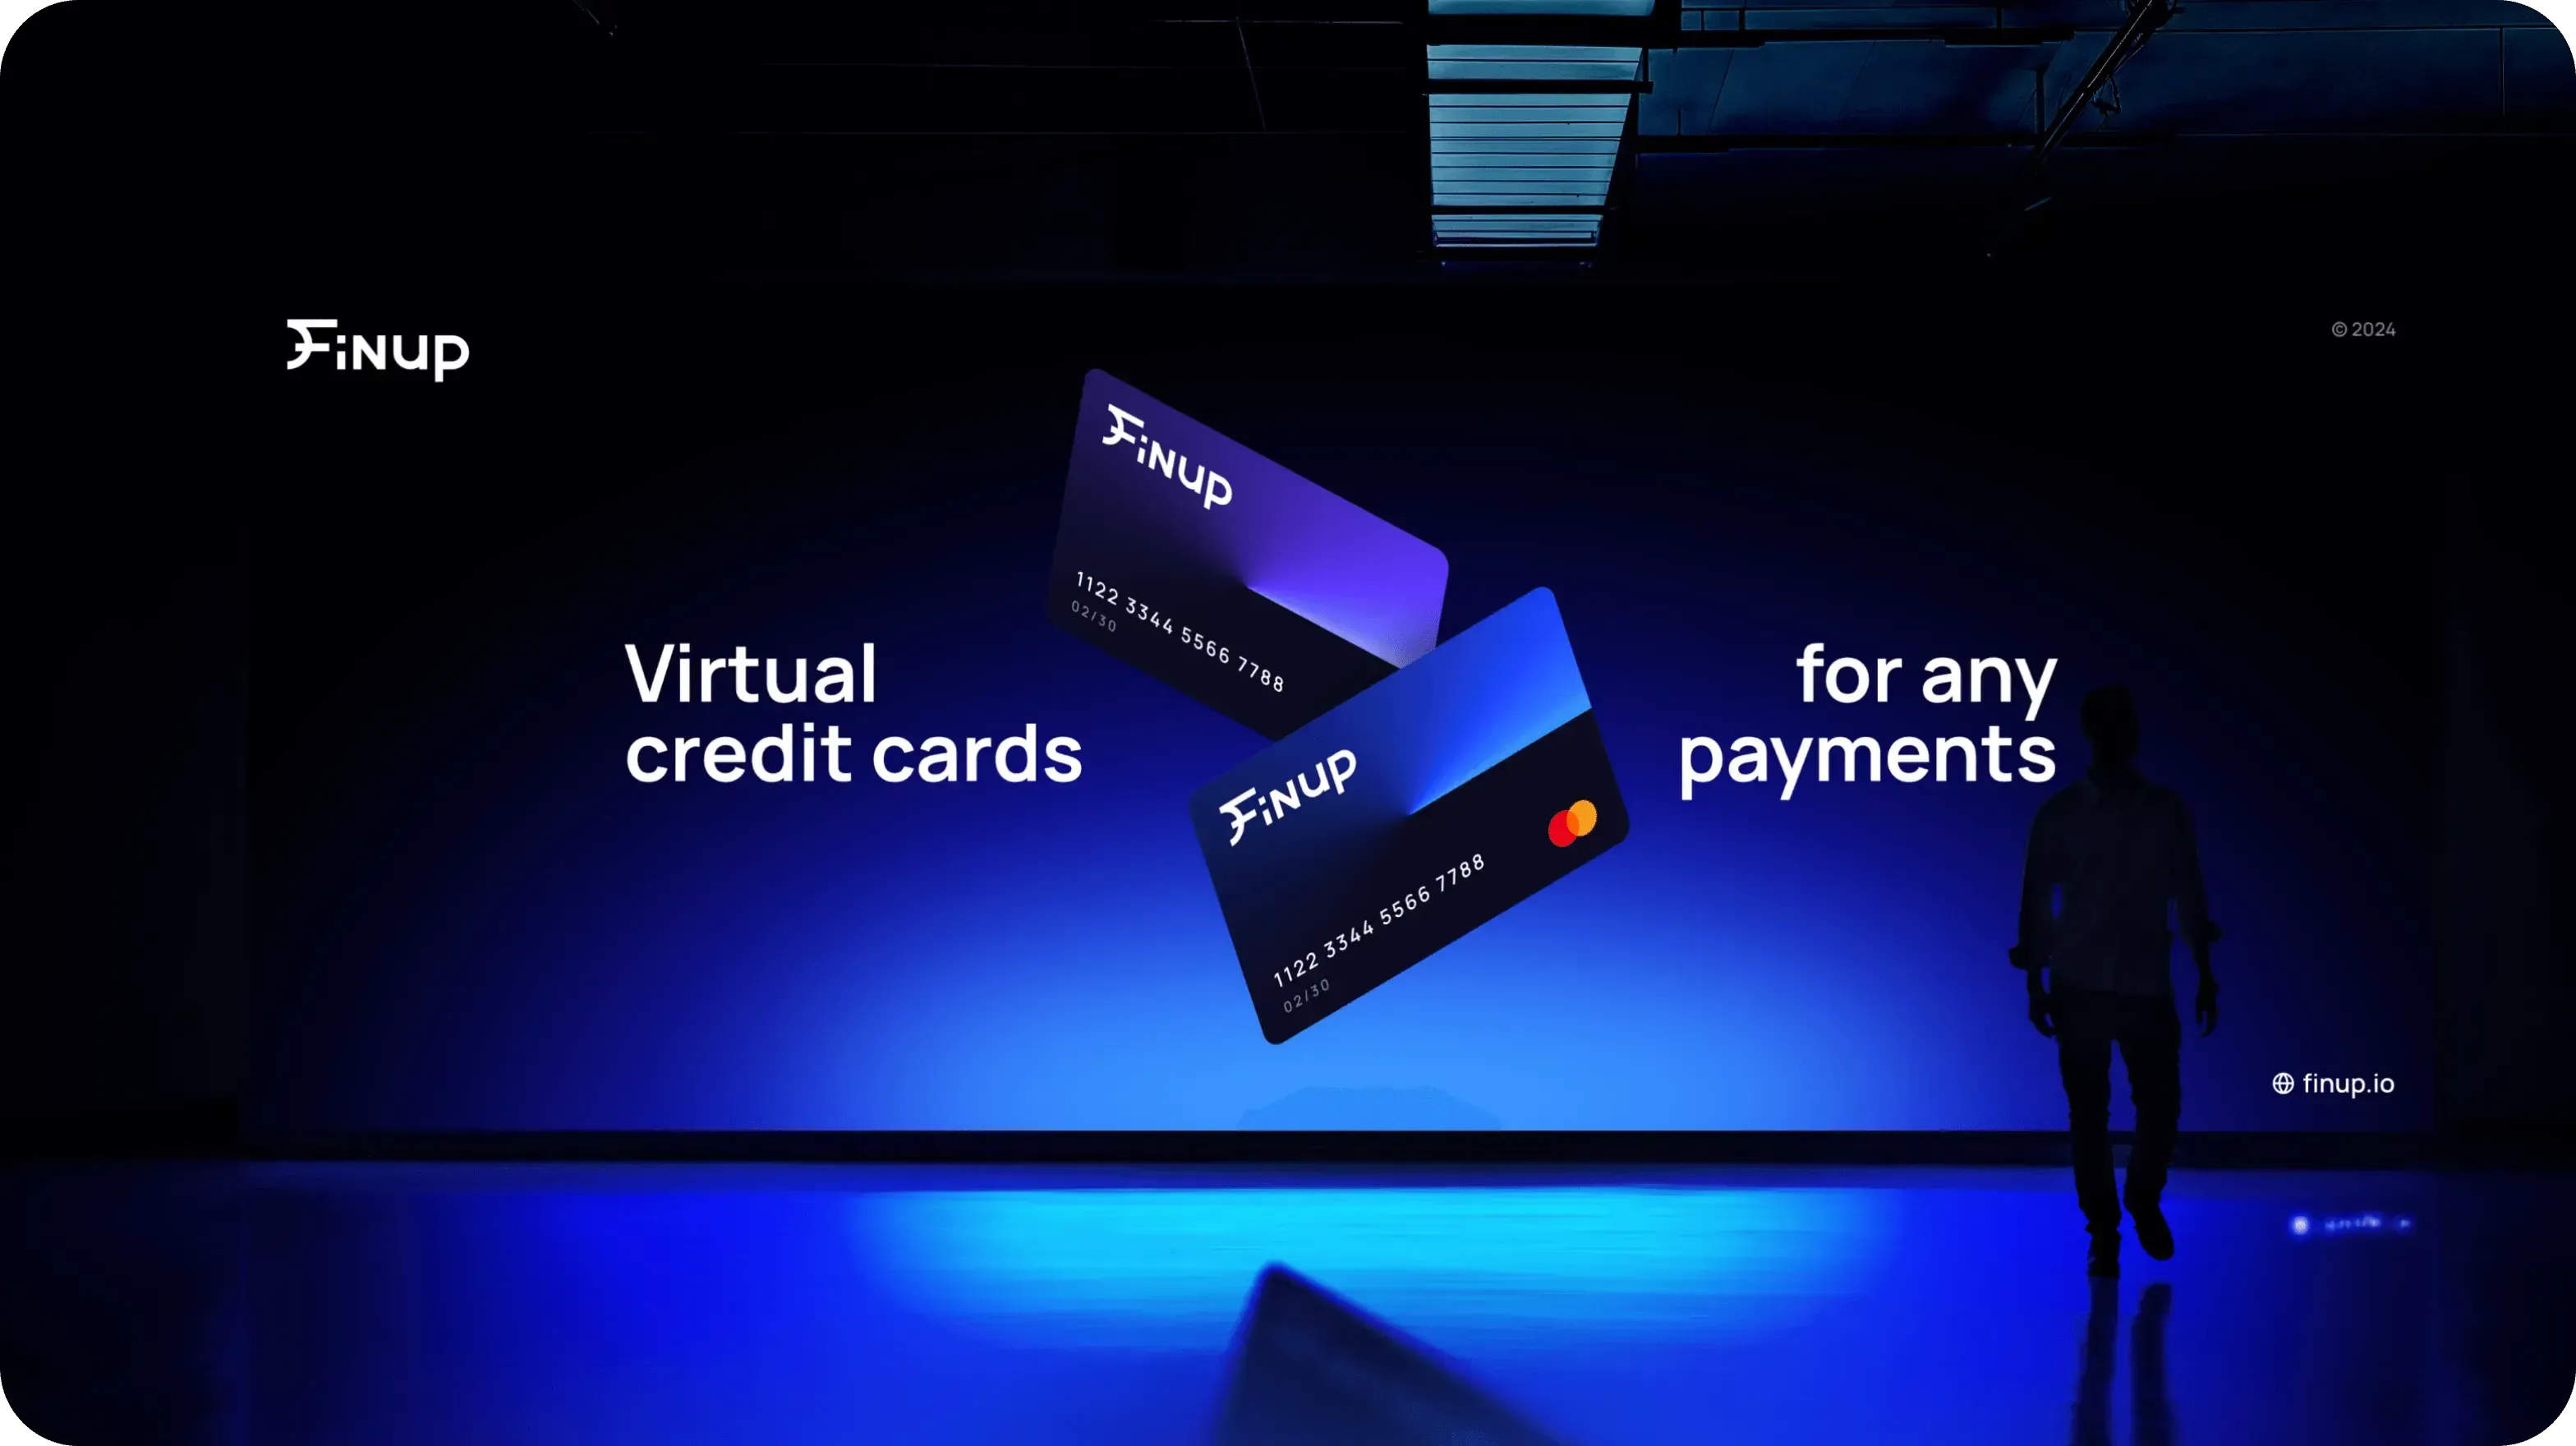
We rebuilt the identity around that goal:
- designing a custom typographic logo that nods to currency symbols through sharp, futuristic forms;
- building a visual system on radial gradients, minimalism, and tech-forward colors;
- extending that system across social templates, merch, and offline touchpoints;
- designing a cohesive card system so the physical product carries the brand too.
As a result, Finup launched with a brand that felt global from the first impression, and the site earned CSS Design Award nominations for Best UI Design, Best UX Design, and Best Innovation.
The rebrand gave Finup a visual language that matched the market it was entering. The identity now supports the company across its website, cards, social presence, and other customer touchpoints.
For a fintech entering new markets, that consistency gives customers a clear read on the company from the first interaction — then the product has to back it up.
Give your brand a different perspective — start a conversation.
Branding trends to watch in 2027
Warmer, more tactile visual language
As AI-generated imagery becomes common, brands are experimenting with visible texture, grain, handmade details, and heritage-inspired typography.
The research cited in the original dataset reports that 60% of consumers say emotional and sensory cues play a decisive role in choosing between brands.
The opportunity is not to make every identity nostalgic. It is to introduce visual cues that give the brand a recognizable point of view.
AI as a production tool
AI can help design teams explore layouts, generate variations, and move through repetitive production work faster.
The brand voice still needs human direction. Teams need to decide what the brand should sound like, what it should stand for, and which ideas deserve to ship.
The stronger model is simple: use AI to expand the production layer while people remain responsible for the creative direction.
Brand systems instead of static guidelines
A PDF style guide cannot carry an identity across dozens of pages, campaigns, product interfaces, and AI-assisted production workflows on its own.
Structured systems give teams reusable components, rules, assets, and content principles they can apply consistently.
This matters even more for B2B companies, where buyers increasingly encounter a brand across many disconnected touchpoints before speaking to sales.
Tactile and neomorphic interfaces
Soft shadows, raised controls, and physical depth cues are returning to digital interface design.
Used carefully, these patterns can make interactive elements easier to distinguish and give interfaces a stronger material character. They work best when the visual treatment supports the interaction rather than becoming decoration.
Purpose needs a clear position
The research cited in the original dataset reports that 94% of consumers say it matters that a company stands for something.
That does not mean every brand needs a grand social mission. It means customers increasingly have access to information about what companies value and how they behave.
A clear position gives the brand something concrete to communicate.
Creator partnerships enter the rebrand process
The dataset reports that 68% of companies attribute measurable revenue growth directly to influencer partnerships.
As creator influence grows, brands can use partnerships to introduce and test new positioning with real audiences before a broader rollout.
The important part is fit: creators should reinforce the new brand rather than become a separate identity around it.
Brand systems need to work for machines too
AI tools increasingly summarize companies, compare vendors, and surface information before a buyer visits a website.
That makes consistency useful beyond visual recognition. Clear positioning, repeated terminology, structured content, and coherent messaging make a company easier to interpret across both human and machine touchpoints
Final thoughts
Branding has a measurable place in business performance. The research connects brand value, design quality, trust, customer experience, and loyalty to outcomes companies can track—from revenue and shareholder returns to customer choice and retention.
Consistency is one of the foundations. Customers encounter a company across its website, product, sales materials, social channels, and support. The brand needs to hold together across all of them.
A rebrand or repositioning makes sense when the business has changed, and the existing identity no longer supports where it needs to go. The numbers can help frame that decision, but they can't make it for you.
Start with the business problem. Build the brand system around it. Then measure what changes.
At Goodface, that's how we approach brand work: strategy, identity, and digital experience working as one system, with a clear reason behind every major decision.
FAQ
What are the biggest risks of rebranding?
The biggest risk is losing recognition and customer familiarity without solving the business problem that triggered the rebrand.
The Cracker Barrel case shows how quickly customers can react to a familiar identity change: 76% of surveyed consumers preferred the old logo after the 2026 change.
A strong rebrand starts with the reason for change, customer expectations, and the company's market position.
When should a company consider rebranding?
Consider a rebrand when the existing identity no longer supports the business: for example, after entering a new market, changing the target audience, repositioning the company, or moving through a major business transformation.
A visual refresh can be enough when the underlying position still works. A broader rebrand makes more sense when the company itself has changed.
How does strong branding affect business performance?
The research connects branding and design with several business outcomes.
Kantar reports faster brand-value growth for Meaningfully Different brands. McKinsey found a 32-percentage-point revenue-growth difference between top-quartile design performers and their peers. Forrester reported a 3.8× revenue lift among US retailers with strong total experience.
The exact outcome depends on the business and the metric being measured, which is why brand projects need a clear baseline and business objective.
Why does brand consistency matter?
Consistency gives customers the same recognizable cues across different interactions.
That matters because customers may encounter a company through a website, product interface, sales deck, social channel, or support interaction. When those touchpoints use the same visual and verbal system, recognition has more opportunities to build.
How long does it take to build brand recognition?
Recognition depends on the brand, category, audience, and frequency of exposure. The more consistent the distinctive assets, the more opportunities customers have to connect them with the company.
Rather than treating recognition as a fixed number of impressions, measure it against the audience and channels that matter to the business.
What's the difference between brand awareness and brand recognition?
Brand awareness measures whether people know a brand exists.
Brand recognition measures whether people can identify the brand from cues such as its logo, color, shape, sound, or visual system without seeing its name.
Both matter, but recognition gives companies a more specific way to evaluate whether their distinctive assets are working.
Read more
 advantage
 Book a call
Fill out the form
or brief with questions



 LinkedIn
 Instagram
Welcome to Goodface privacy notice.
Goodface respects your privacy and is committed to protecting your personal data. This privacy notice will inform you as to how we look after your personal data when you visit our website (regardless of where you visit it from) and other sites we own and operate. And tell you about your privacy rights and how the law protects you.
We may change the privacy policy from time to time to reflect changes to the products and services that we provide and how we process your personal data.
We will not share your information with any third party outside of our organization, other than as necessary to fulfil your request if any."
INFORMATION WE COLLECTWhen you visit our website, our servers may automatically log the standard data provided by your web browser. This data is considered “non-identifying information”, as it does not personally identify you on its own. It may include:
- Your computer’s Internet Protocol (IP) address;
- Your browser type and version;
- The pages you visit;
- The time and date of your visi;
- The time spent on each page;
We may ask for personal information, such as your name and email address. This data is considered “identifying information”, as it can personally identify you. We only request personal information relevant to providing you with a service, and only use it to help provide or improve this service.
We collect information by fair and lawful means, with your knowledge and consent. We also let you know why we’re collecting it and how it will be used. You are free to refuse our request for this information, with the understanding that we may be unable to provide you with some of your desired services without it.
We will only process personal data and communicate with you if:
1. You have given us consent to the processing of your personal data and communicating for one or more specific purposes i.e. requesting products or services from us, downloading material or information from our website or submitting a contact us form.
2. Performance of a contract
3. Where we have a legitimate interest for contacting you in relation to our products and services
DATA PROCESSING AND STORAGEWe only retain personal information for as long as necessary to provide a service, or to improve our services in future. While we retain this data, we will protect it within commercially acceptable means to prevent loss and theft, as well as unauthorised access, disclosure, copying, use or modification. That said, we advise that no method of electronic transmission or storage is 100% secure, and cannot guarantee absolute data security.
Rights and choices of individuals:
- See what data we have about you, if any;
- Change/correct any data we have about you;
- Have us delete any data we have about you;
- See what security measures we apply to your data;
- Express any concern you have about our use of your data;
You may opt out of any future contacts from us at any time. You can do the following at any time by contacting us via the email address given on our website: goodface.agency
Got questions or want to discuss a project?


