

35+ UX Statistics & trends for 2027: what's worth your attention





35+ UX statistics for 2027 | 1:52 min
No time to read? Explore through headphones, speakers, or on the go.
TL;DR
UX shows up in revenue, conversion, retention, accessibility, and the cost of building & delivering custom digital products.
Here are the numbers worth keeping on your radar in 2027:
- 70.22% — average e-commerce cart abandonment rate across 50 studies.
- 35.26% — potential conversion increase from improving checkout usability on large e-commerce sites, according to Baymard's research.
- $260B — estimated recoverable order value across US and EU e-commerce sales if those checkout improvements were achieved.
- 95.9% — share of the top one million homepages with detected WCAG failures in WebAIM's February 2026 analysis.
- 56.1 — average number of detectable accessibility errors per homepage in that same dataset.
- 8.4% — retail conversion increase associated with a 0.1-second mobile speed improvement in Deloitte's research.
- 351% — modeled three-year ROI in Forrester's 2025 Total Economic Impact study of Figma Dev Mode, commissioned by Figma.
- 3.8×—revenue lift for US retailers running a strong total experience over those that don't.
- 44.7% — share of the web still failing at least one Core Web Vital.
- 75% — average lift in key metrics from UX-led redesigns, against incremental tweaks.
The useful question is which product decisions move these numbers for your business.


How we selected these UX stats
Old benchmarks, vendor claims, secondary summaries, and original research don't carry the same weight, so we don't treat them like they do.
We built this list on four rules:
- Primary resource first. The organization that ran the research gets priority.
- Date the evidence. An older benchmark earns its place only when it still holds up today.
- Keep methodology close to the number. Sample size, study period, and research type travel together.
- Separate measured results from forecasts. A Gartner prediction about 2027 and a WebAIM analysis of one million homepages carry different weight, and we label them that way.
We hold that line because it drives the calls you make next: on product, on design, on where the budget goes.
Key UX statistics for 2027
| # | Category | UX statistic | Source |
| 01 | UX ROI & business impact | 3.8× revenue lift for US retailers with a strong total experience | Forrester, 2026 |
| 02 | UX ROI & business impact | Nearly 3× revenue growth for companies ranking in the top 20% for design and innovation behaviors | IDEO, 2026 |
| 03 | UX ROI & business impact | 351% three-year ROI from Figma Dev Mode in Forrester's modeled analysis | Forrester / Figma |
| 04 | UX ROI & business impact | Up to 10.8% higher revenue retention from continuous UX research over three years | Forrester / UserTesting |
| 05 | UX ROI & business impact | 50%+ of organizations save more than 20% through digital transformation | Deloitte, 2025 |
| 06 | Conversion & user behavior | Payment options shown earlier increase purchase likelihood | Journal of Retailing, 2026 |
| 07 | Conversion & user behavior | 93% of shoppers want a straightforward checkout | IDC, 2026 |
| 08 | Conversion & user behavior | 70.22% of ecommerce carts are abandoned globally | Baymard |
| 09 | Conversion & user behavior | Better checkout design could produce a 35.26% conversion lift on large ecommerce sites | Baymard |
| 10 | Conversion & user behavior | $260B in estimated recoverable ecommerce orders across the US and EU | Baymard |
| 11 | The cost of poor UX | 32% of customers stop doing business with a brand after one bad experience | PwC |
| 12 | The cost of poor UX | 59% leave after several bad experiences | PwC |
| 13 | The cost of poor UX | Users can form a design impression within 50 milliseconds | Original research / cited source |
| 14 | The cost of poor UX | 51% of top 1M homepages have missing or mislabeled form fields | WebAIM, 2026 |
| 15 | The cost of poor UX | 38% of IT specialists cite technology literacy as an obstacle to digital transformation | Deloitte |
| 16 | UX & accessibility | 73% of users leave a site that isn't mobile-friendly | Neil Patel / cited source |
| 17 | UX & accessibility | 56% of assistive-technology users regularly encounter inaccessible apps | Applause, 2026 |
| 18 | UX & accessibility | 96% of detected WCAG failures fall into six recurring issue categories | WebAIM, 2026 |
| 19 | UX & accessibility | 4,928 digital accessibility lawsuits were filed in the US in 2025 | UsableNet / cited legal data |
| 20 | UX & accessibility | More than half of global web traffic comes from smartphones and tablets | Sensor Tower, 2026 |
| 21 | Speed & performance | A 2-second delay can increase bounce rates by up to 103% | Akamai, 2026 |
| 22 | Speed & performance | Only 55.3% of 18.2M web origins passed all Core Web Vitals in June 2026 | Chrome UX Report |
| 23 | Speed & performance | 8.9% mobile conversion lift after a 68% improvement in LCP | Nuvemshop, 2026 |
| 24 | Speed & performance | Consistent experiences can produce a 25% increase in user trust | NN/g |
| 25 | Speed & performance | Ray-Ban doubled conversion rates and reduced exits by 13% using preloading/speculation | Google / web.dev |
| 26 | Product redesign & UX improvement | NN/g recommends allocating around 10% of project budget to usability | NN/g |
| 27 | Product redesign & UX improvement | Testing with 5 users can reveal ~85% of usability problems | Nielsen & Landauer |
| 28 | Product redesign & UX improvement | UX-led redesigns produce an average 75% improvement in UX metrics | NN/g |
| 29 | Product redesign & UX improvement | Removing a forced registration step generated an estimated $300M in additional sales | Jared Spool / cited case |
| 30 | Product redesign & UX improvement | SaaS onboarding research identifies activation and time-to-value as key measures of onboarding effectiveness | Userpilot |
| 31 | UX industry benchmarks | UX/product design services market valued at $5.5B, growing at 14.5% annually | Grand View Research |
| 32 | UX industry benchmarks | Figma is the most frequently mentioned skill across 330 UI/UX job postings | Skillenai |
| 33 | UX industry benchmarks | 66% of teams report rising demand for user research, up from 55% | Maze, 2026 |
| 34 | UX industry benchmarks | Continuous testers report 2.4× higher conversion rates than occasional testers | SearchLab / cited source |
| 35 | UX industry benchmarks | 16% employment growth projected for web developers and digital designers through 2031 | US BLS |
UX stats by category
Firstly, what is UX in statistics and why do we need it? It is the measurable side of user experience; in other words — the data that shows how design affects behavior, performance, and business results.
The benchmarks below map where design decisions move the needle on product performance.
1. UX ROI & business impact
UX left the "nice-to-have" line of the budget years ago. Teams now measure it next to marketing spend and sales headcount, in dollars returned per dollar spent. Let’s look at some UX design ROI statistics:
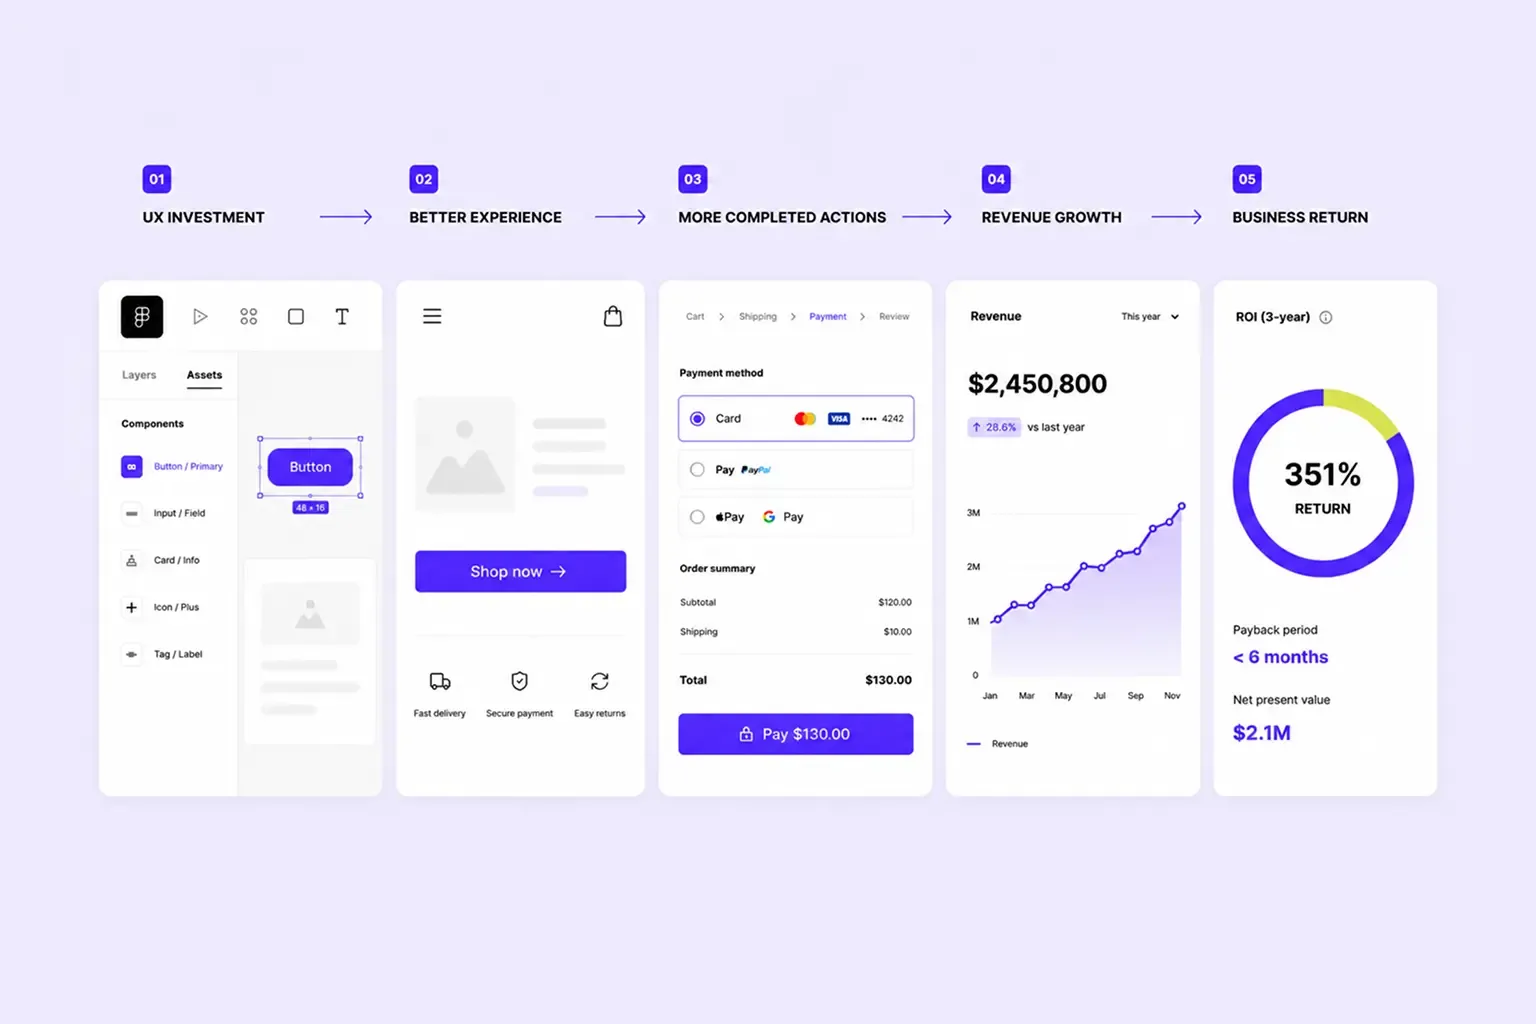
Great experiences multiply revenue
Forrester's 2026 research found that US retailers delivering a strong total experience — aligning brand promise with the customer experience — can achieve a 3.8× revenue lift, while automotive firms see a 2.6× lift.
Human-centered design correlates with nearly 3× revenue growth
IDEO's 2026 Innovation Quotient found that companies in the top 20% for design and innovation behaviors report nearly three times the revenue growth of the average company.
351% ROI from UX and design tools
Forrester’s Total Economic Impact analysis estimates that organizations using UX and design tools such as Figma Dev Mode can achieve a 351% return on investment over three years, driven by faster workflows and tighter collaboration.
Continuous testing compounds
The same study found that organizations running ongoing UX research improved revenue retention by up to 10.8% over three years — gains that stack rather than reset each quarter.
Digital transformation pays for itself
Deloitte’s 2025 research found that half of organizations save more than 20% through digital transformation, with improvements in customer and employee experience adding further value. The number shows that by 2027 it will be higher.
Line these five up and UX stops looking like a cost center. It shows up on the P&L with a payback period finance can model — route the budget through a design-department line item instead, and that return stays on the table.
2. Conversion & user behavior
Conversion data tells you exactly where a user's patience runs out. Checkout is where most of it happens.
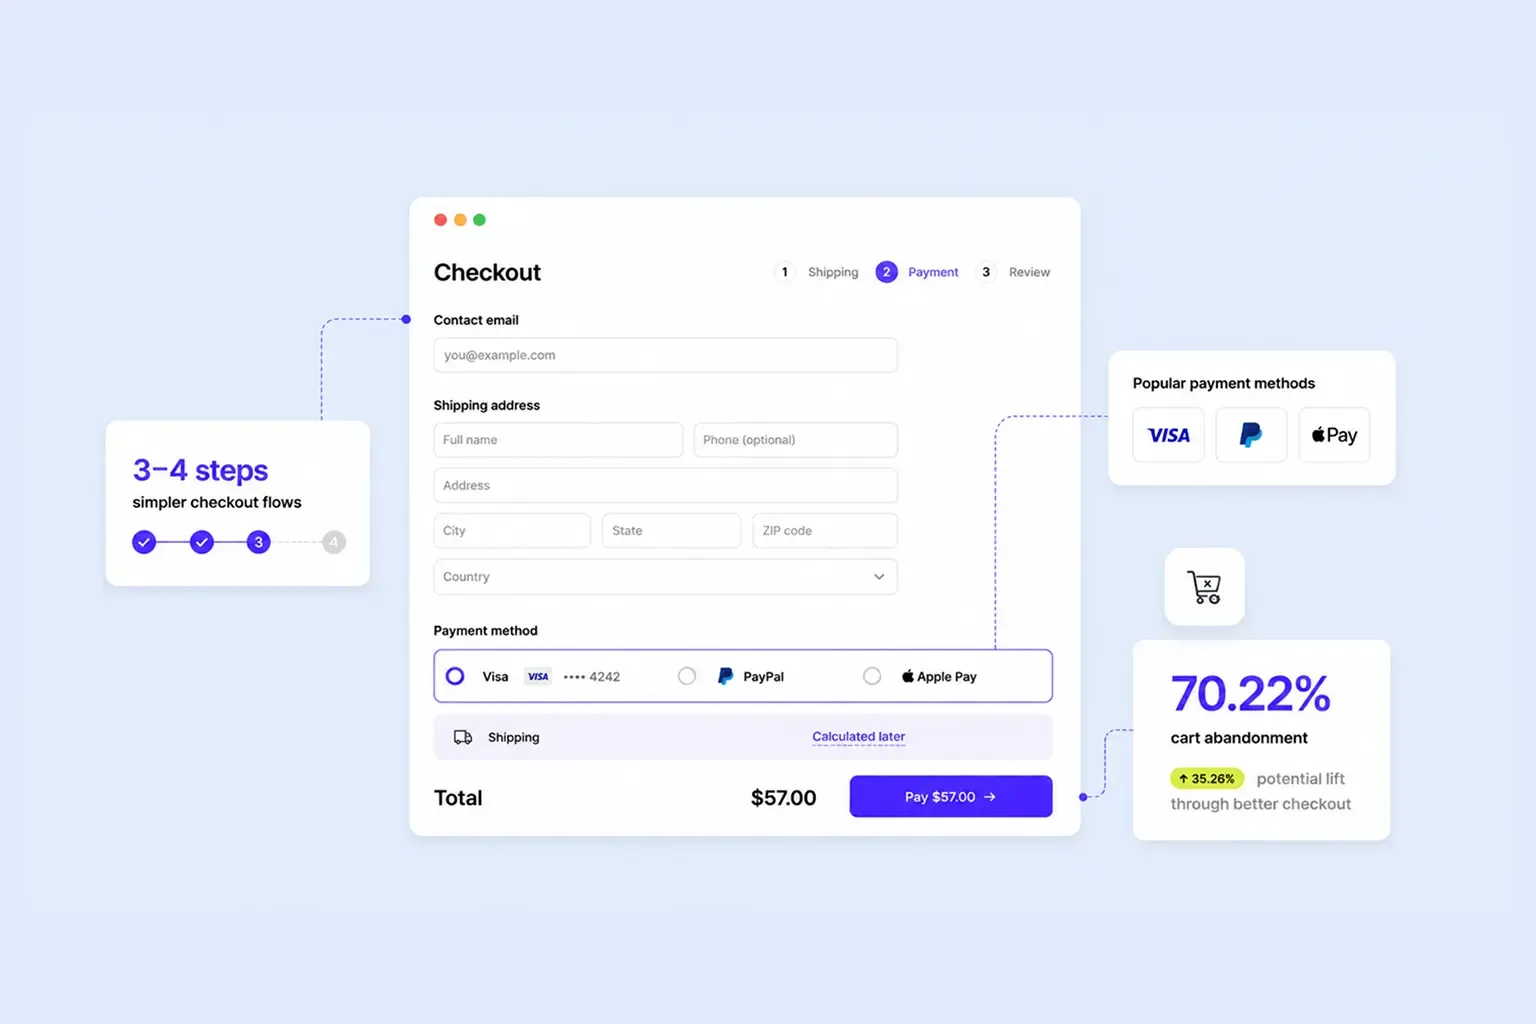
Remove friction and uncertainty at the point of commitment
In the Embody app, we cut the steps between quiz and product with deep links, secure tokens, and auto-filled login, and we showed users their personalized plan before asking them to commit. That combination targets the two barriers that block conversion: friction and hesitation.
Show the payment path before checkout
A 2026 Journal of Retailing study across four field and online experiments found that surfacing payment options on product pages lifted purchase likelihood. The result — a clearer payment picture reduces uncertainty before checkout even starts.
93% of shoppers want a straightforward checkout
Yet one in three merchants doesn't prioritize it, per a 2026 IDC Research study of 8,000 consumers and 740 businesses. Here, the gap is present in the experience between intent and purchase.
70.22% of ecommerce shopping carts are abandoned globally
Baymard's research puts the upside at a 35.26% average conversion lift for large ecommerce sites through better checkout design alone — an estimated $260 billion in recoverable orders across the US and EU.
Simplified flows convert more
Checkout flows trimmed to 3 or 4 steps significantly cut abandonment compared to longer, form-heavy processes — the fewer decisions between "add to cart" and "confirm," the better.
Every stat here traces back to the same moment: the second a user has to stop and think instead of act. Fewer fields, clearer pricing, fewer redirects — cut that thinking time and move conversions before you spend another dollar on acquisition.
3. The cost of poor UX
Bad UX turns one failed interaction into lost revenue. It closes the door on every sale that would have followed.
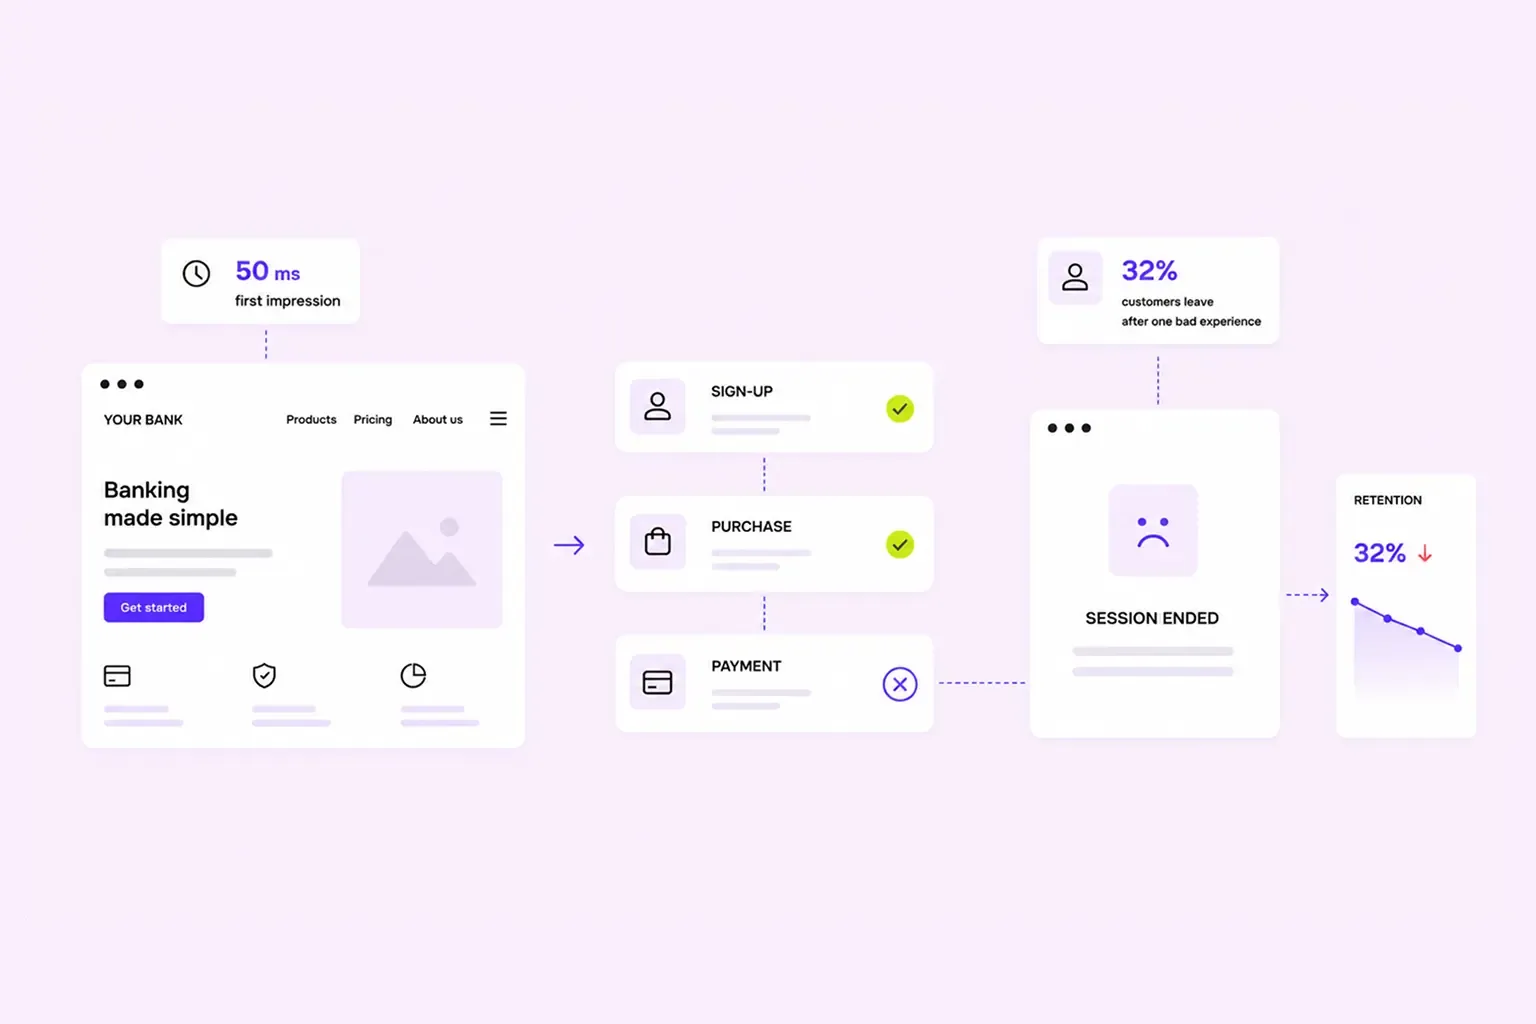
Design quality moves business performance
Forrester research shows that well-designed digital experiences significantly improve conversion outcomes, demonstrating that usability and interface quality are closely tied to commercial results.
Poor digital experiences erode loyalty fast
PwC’s research found 32% of customers stop doing business with a brand after one bad experience, and 59% leave after several. UX problems compound into weaker trust and lower retention.
First impressions form in milliseconds
Users register a design opinion within 50 milliseconds and lock in a lasting judgment by 3.5 seconds — faster than most pages take to load their hero image.
Half of major websites still ship broken form UX
WebAIM's 2026 analysis found 51% of the top 1 million homepages carry missing or mislabeled form fields, sitting directly on the path to sign-up and checkout.
Tech complexity drags on output
Deloitte identifies technology complexity as a barrier to digital transformation, with 38% of IT specialists citing tech literacy as an obstacle — poorly integrated systems drag on workflows and cap the return on tech investment.
The bill for poor UX rarely arrives as one line item. It shows up as slower quarter-over-quarter growth, higher paid-acquisition spend covering for lost organic trust, and support tickets that a five-user test would have caught for free. Budget for prevention, and most of that bill never gets written.
4. UX & accessibility
Mobile and accessibility are in the same category for a reason: both describe how many real users a product reaches, not how many it was designed for.
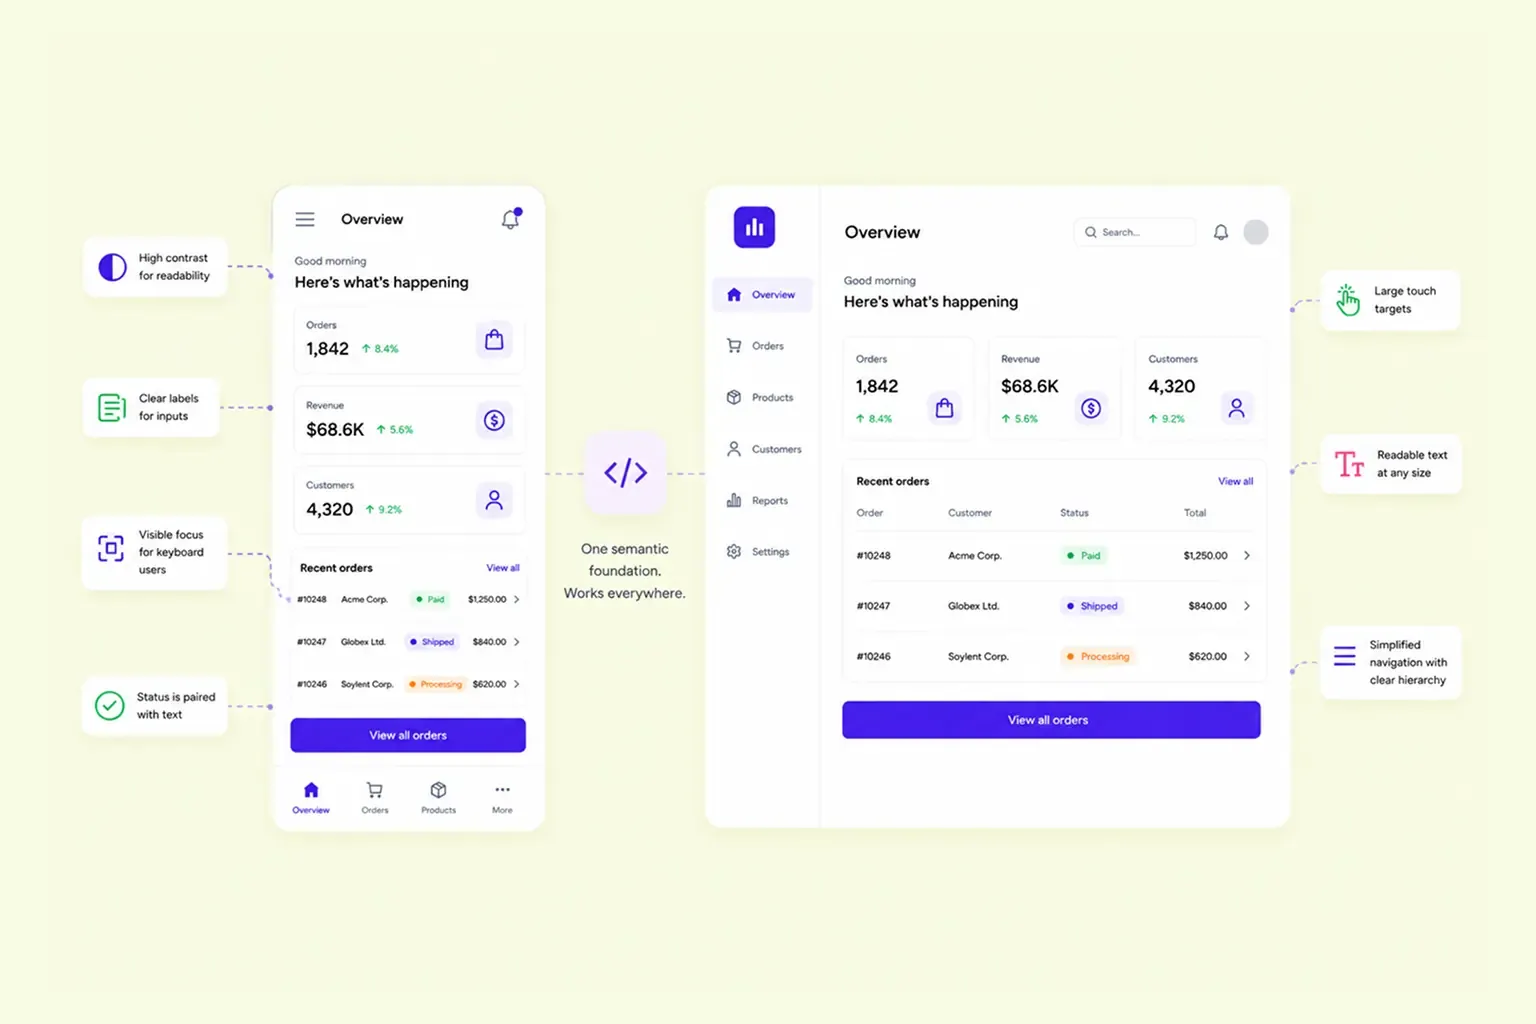
No mobile fit, no visit
73% of users leave a site that isn't mobile-friendly, regardless of how strong the desktop experience is.
Accessibility problems still reach users in real apps
Applause's 2026 State of Digital Quality in Accessibility report found that 56% have regularly hit inaccessible apps since the start of 2026, surveying more than 1,000 assistive-technology users.
Six issues, 96% of the damage
The recurring accessibility issues (low-contrast, missing alt text, missing form labels, empty links, empty buttons, and missing form labels) account for 96% of all detected WCAG failures on the web, according to WebAIM's 2026 analysis of the top one million homepages.
Lawsuits followed the gap
What to keep an eye on in 2027? US digital accessibility lawsuits hit 4,928 in 2025, federal filings up 27% year over year, and over a third of defendants had already installed an accessibility widget before being sued. Proof that overlay tools don't substitute for fixing the underlying code.
Our verdict: build with accessibility in mind from the very beginning. Otherwise, this stat goes through the roof by 2027.
Mobile devices come first
Over half of global web traffic today originates from smartphones and tablets, highlighting their significance in overall digital strategy.
Run mobile and accessibility as one entity. When you approach them separately, you miss where they overlap.
The solution: adjust the underlying markup once, and you clear both checks in the same pass instead of paying for two rounds of fixes.
5. Speed & performance
Speed is the one UX metric users never have to be taught to notice. They feel it in the first half-second.
Two seconds send users running
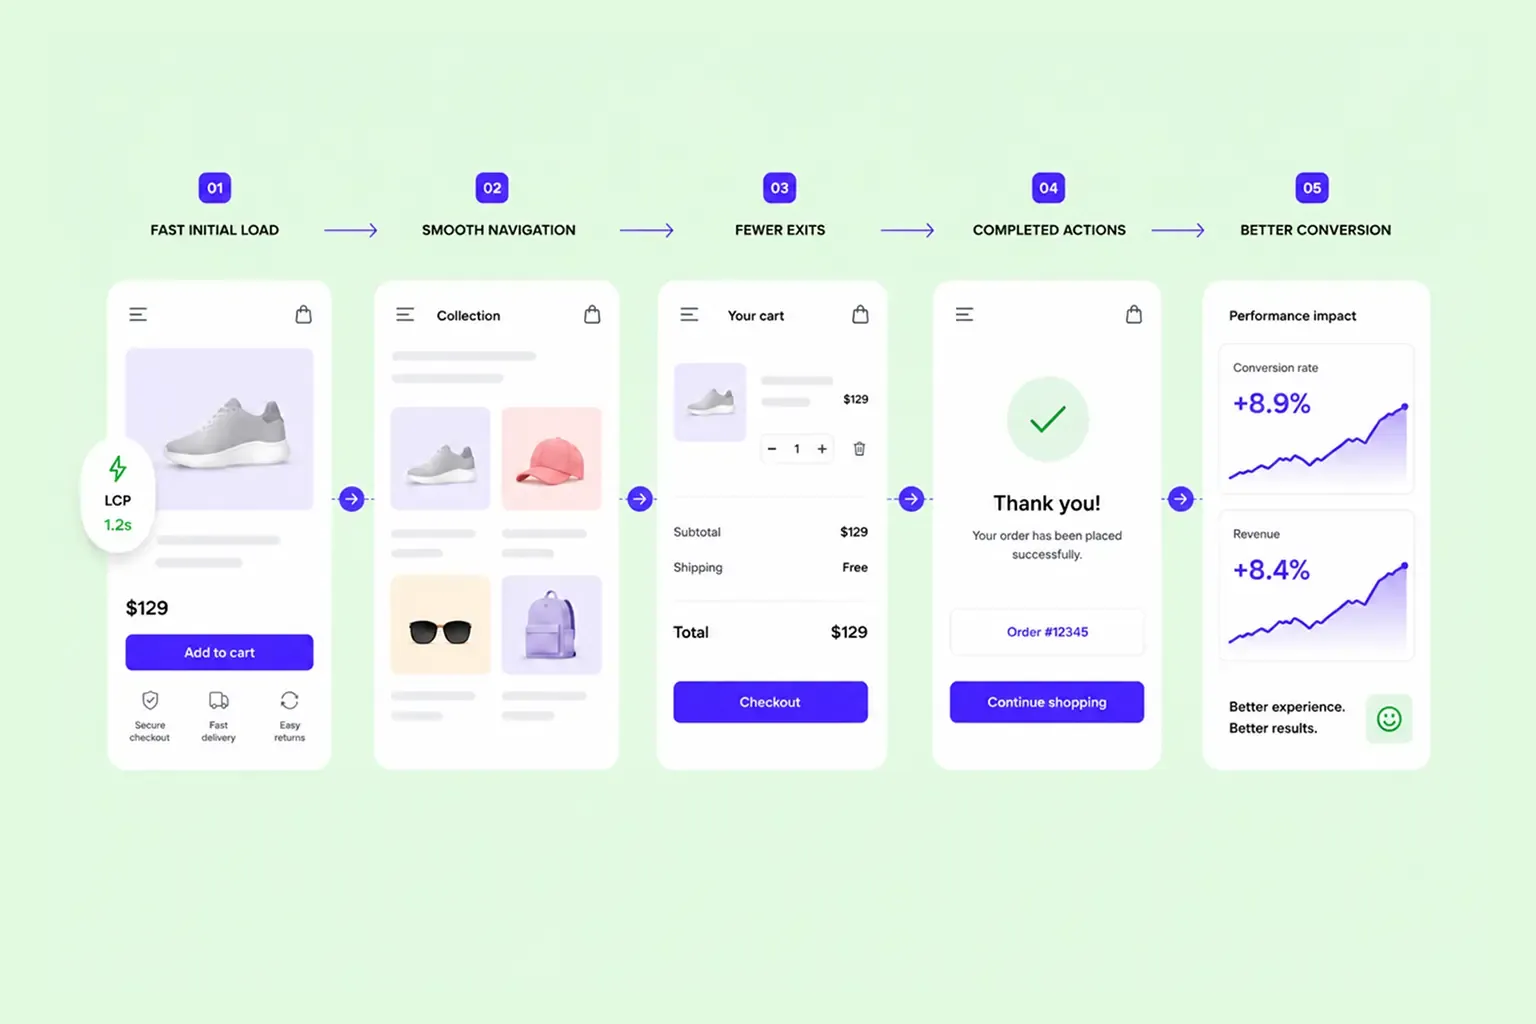
Akamai's 2026 performance guidance ties a 2-second delay to bounce-rate increases of up to 103%.
Nearly half the web still misses Google's performance bar
Google's June 2026 Chrome UX Report found only 55.3% of 18.2 million web origins passed all Core Web Vitals: 44.7% failed at least one, and just 67.7% hit good LCP.
Faster pages convert more
After improving LCP performance by 68%, Nuvemshop's 2026 analysis logged an 8.9% lift in mobile conversion and 8.4% more cart engagement across the same ecommerce cohort.
Every consistent interaction reinforces trust
Delivering a consistent experience across every touchpoint can lead to a 25% rise in user trust and repeat visits.
Performance is part of navigation design
By making likely next pages available before users needed them, Ray-Ban doubled conversion rates and cut exit rates by 13%. The smoothest path for users is the main goal.
Speed compounds with everything else on this page. A faster page lowers bounce, raises the odds a user reaches checkout, and buys back the seconds your accessibility and conversion fixes need to land. Ship performance work first. Every fix you make after it works harder.
6. Product redesign & UX improvement
Website redesign objectives start with calculable before-and-after. The gains have shrunk over the past decade but are still on their way to disappearing.
10% of budget, outsized upside
NN/g recommends allocating 10% of a project's budget to usability work, a figure that scales with company size: the larger the user base, the bigger the return on the same percentage spend.
Five users, most of the problems
A classic that gets overlooked to this day: testing with just five users surfaces 85% of a product's usability issues. Comprehensive testing doesn't require a large sample, only the right questions to ask.
UX-led redesigns average 75% gains
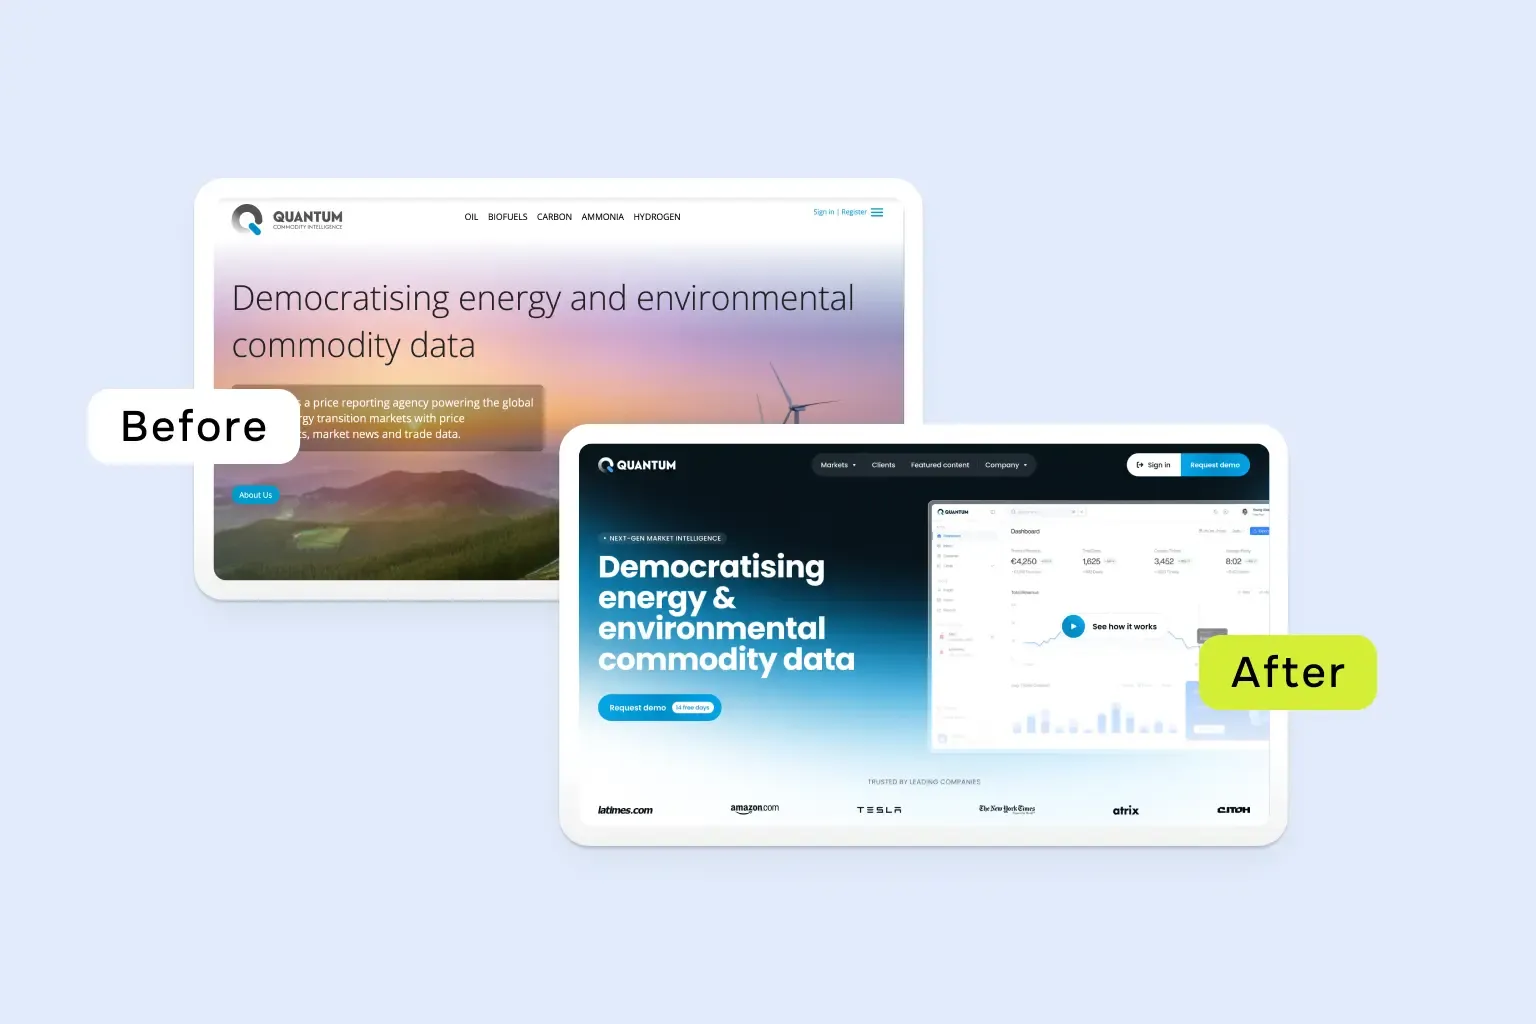
Across NN/g's recent case studies, UX-driven redesigns lift key UI/UX performance metrics by 75% on average, with complex B2B domains often landing higher.
One button rename, real revenue
Replacing a forced "Register" step with guest checkout added an estimated $300 million in sales for one major retailer — a single-word change with a nine-figure result.
Onboarding redesigns move activation
Research across 100+ SaaS products highlights activation and time-to-value as key measures of onboarding effectiveness, suggesting that reducing friction in the onboarding flow can help users reach meaningful product value faster.
The pattern we see across these five: small moves beat full rebuilds. A rename, a shortened flow, or a five-user test costs a fraction of a ground-up redesign and moves the same metrics.
Make a redesign pay off & let's connect UX decisions to your vital business metrics. Start a conversation.
7. UX industry benchmarks
Benchmarks tell you where the discipline stands as an industry — headcount, tooling, spend, and the gap between teams that test and teams that guess.
The market is growing
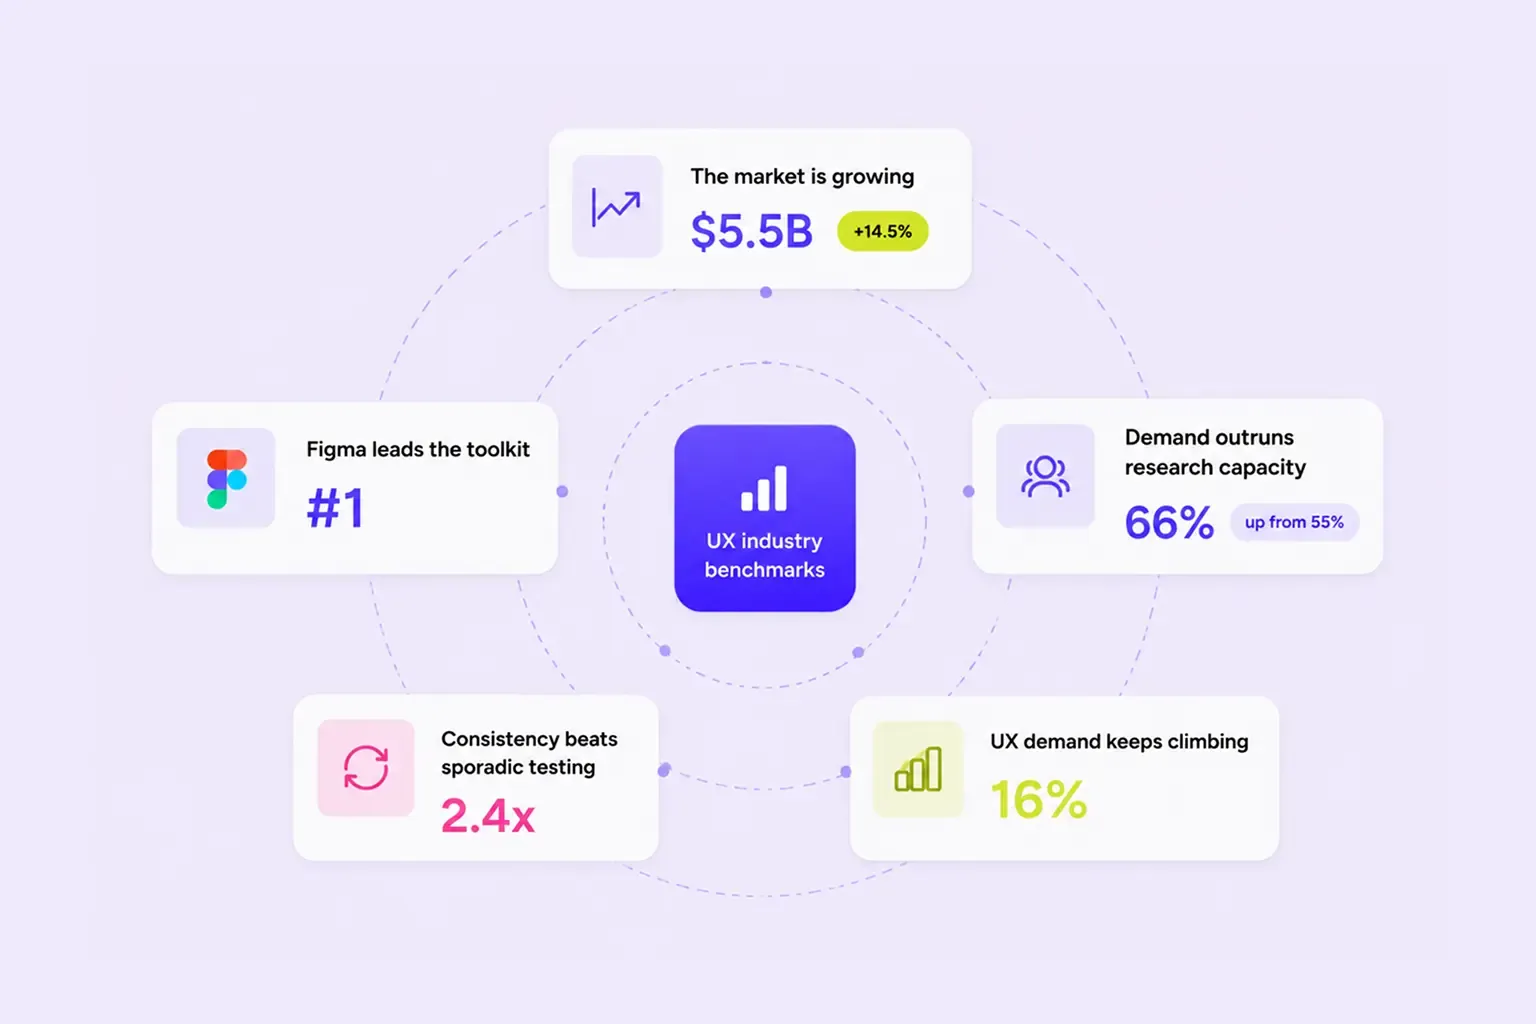
The UX design growth rate is valued at $5.5 billion, expanding at a 14.5% annual rate. This is a growth that outpaces most adjacent software categories.
Figma leads the toolkit
Skillenai currently reports Figma as the most frequently mentioned skill across 330 UI/UX Designer postings, cementing it as the default tool candidates are expected to know before they walk in the door.
Demand is outrunning research capacity
Maze's 2026 industry survey found 66% of teams report rising demand for user research, up from 55% the year before. UX teams answer more questions more often, while headcount hasn't caught up.
Consistency beats sporadic testing
Companies that test continuously see 2.4x higher conversion rates than those that test occasionally — cadence matters as much as the testing itself.
UX demand keeps climbing
The US Bureau of Labor Statistics projects 16% growth for web developers and digital designers through 2031, a hiring outlook well ahead of the average occupation.
Build a research practice that outlasts any single project. Otherwise, the gap between what stakeholders ask for and what your team can test gets wider.
What these UX design statistics mean for digital products
A high cart abandonment rate can send you into checkout. Accessibility data can expose problems with forms, buttons, or content. Performance data can justify work that might otherwise remain low on the backlog. Employee-facing products face the same problem: too many steps, too much information, and too much time spent on routine tasks.
This is where benchmarks become useful. They give a product team a reference point, but they don't tell you what to redesign. That still comes from looking at the product, talking to users, and seeing where people struggle.
We also don't think every problem needs a redesign:
- Sometimes one form field needs to go.
- Sometimes a workflow needs fewer approvals.
- Sometimes a page needs to load faster.
- Sometimes the product needs a clearer explanation at exactly the right moment.
Good UX work starts with those details. Find the task that causes the most trouble, understand why it happens, and make that part of the product work better. That is usually where the most valuable design decisions originate.
The numbers tell you where UX creates value — set the goals for website redesign with us. Let’s discuss your product issues.
UX insights: what Goodface experts notice
UX statistics are useful when they help identify where a product makes people work harder than necessary. We use them as a reference point, then look at the actual product, its users, and the tasks they need to complete. Our work with Emerald24 is a good example.
How we helped Emerald24 achieve a better user flow: product redesign case study

Emerald24 is a digital payments platform with complex banking workflows across web and mobile. When we started the redesign, onboarding could take 40–60 minutes, payment approvals involved repetitive actions, and different user roles needed different product information.
We redesigned the experience around those workflows.
The main changes included:
- using progressive disclosure to reduce the amount of information shown at once;
- prioritizing features around different user roles and tasks;
- simplifying payment approval flows with batch signing;
- connecting key banking journeys across web and mobile.
As a result, onboarding time dropped from 40–60 minutes to 20–30 minutes.
The broader lesson is straightforward: a UX metric is useful when it points to something the product team can change. In Emerald24's case, reducing friction meant changing the workflow structure.
That is the role UX plays in complex digital products: make important tasks easier to complete, then measure whether the change worked.
If your product shows up in any of the stats above, we'll build a refined version that drives engagement. Get in touch with our team.
UX trends to watch in 2027
The numbers above describe where UX stands today. Here's where we think design work moves next. Most of it is already shipping.
Goodface sees the following shift in design development:
Generative UI becomes part of product systems
Interfaces can increasingly assemble information, controls, and next steps around the task at hand.
This changes the designer’s role. Instead of defining every possible screen, teams need to define the rules behind the interface: what appears, when it changes, and how users understand those changes.
Generative UI has the most value when it removes unnecessary decisions or steps while keeping familiar workflows predictable.
AI agents take on more of the workflow
Gartner expects task-specific AI agents to appear in up to 40% of enterprise applications, while one-third of agentic implementations could combine agents with different skills by 2027.
This puts new questions on the UX team’s table. What can the agent handle on its own? Where does a person need to approve an action? How does the product show progress? What happens when the agent makes a mistake?
Designing those boundaries becomes part of designing the product.
Accessibility moves into product architecture
WebAIM's 2026 analysis found detectable WCAG failures on 95.9% of the top one million homepages, with an average of 56.1 detected errors per page.
Teams have more reason to address accessibility throughout the product lifecycle. Design systems, components, content, interaction logic, and testing all play a role. A final accessibility audit can catch problems, but it cannot replace decisions made earlier in the process.
Predictive interfaces need clearer user control
Products increasingly predict actions, rank information, and recommend decisions. Users still need enough context to evaluate those results.
Interfaces can make this easier by showing why something happened, what changed, and what the user can still control. This matters even more in payments, financial products, and other workflows where an automated decision can have real consequences.
Enterprise UX shifts toward outcomes
AI agents can reduce the number of tools and manual steps employees need to complete a task. Gartner estimates that $234 billion in US enterprise application software spending could be at risk from agentic AI through 2030.
For enterprise products, this creates a different design priority. Teams can spend less effort refining every manual step and more effort deciding which steps can disappear, where human input still matters, and how several systems should work together.
In 2027, UX work will reach further into the logic, workflows, and decisions behind the interface.
Bottom Line
The strongest UX programs in 2027 have one thing in common: they connect design decisions to measurable product behavior.
The data gives teams plenty of places to look:
- checkout friction;
- accessibility failures;
- mobile performance;
- unnecessary form fields;
- research gaps;
- fragmented workflows;
- AI interactions without clear user control.
The next step is to find which one is costing your product the most.
Goodface works with teams on that part — from UX research and product redesign to design systems and full product development.
Sources & methodology
This article prioritizes primary research and clearly dated secondary sources. Historical statistics are labeled where their original research predates 2027. Vendor-commissioned research is identified rather than presented as independent industry evidence.
Primary and first-party research
- Baymard Institute — cart abandonment, checkout usability, form complexity, and ecommerce UX benchmarks. Current cart-abandonment average: 70.22%, based on 50 studies.
- WebAIM — 2026 WebAIM Million analysis of one million homepages, collected in February 2026.
- PwC — 2025 Customer Experience Survey.
- Forrester — 2026 Global Total Experience Score research covering 375 brands.
- McKinsey — The Business Value of Design / McKinsey Design Index research.
- Forrester Consulting / Figma — 2025 Total Economic Impact study of Figma Dev Mode. The study was commissioned by Figma and modeled from four decision-maker interviews.
- Deloitte / Google — Milliseconds Make Millions, analysis of mobile speed and commercial outcomes.
- US Bureau of Labor Statistics — current 2024–2034 employment projections for web developers and digital designers.
- Gartner — 2025 forecasts for task-specific AI agents and agentic AI adoption through 2027.
- W3C — WCAG 2.2 Recommendation.
Historical UX benchmarks
Some widely used UX benchmarks predate 2027. We retain them where the underlying research still provides useful context, but we do not present them as current market measurements.
- Nielsen Norman Group — usability-testing budget guidance, 2003.
- Nielsen & Landauer — usability-problem discovery model behind the five-user rule.
- Nielsen Norman Group — UX redesign case-study benchmark.
- Baymard — long-running ecommerce checkout research.
Editorial note
Statistics can describe a market, but they can’t predict the result of a specific redesign. Product type, audience, baseline performance, traffic, business model, implementation quality, and measurement method all affect the outcome.
Use the benchmarks above to frame a product question. Then measure the product itself.
FAQ
What is the average ROI of UX design?
A widely cited Forrester estimate suggests that every $1 invested in UX can return up to $100, representing a potential 9,900% ROI. However, actual returns vary by product, industry, and the type of UX improvement implemented.
How does UX affect conversion rates?
UX affects conversion by reducing friction across the customer journey. Clear navigation, shorter checkout flows, intuitive interfaces, and fast performance can make it easier for users to complete key actions.
How much does poor UX cost businesses?
There is no universal cost of poor UX because it depends on traffic, conversion value, retention, and the severity of usability issues. However, the impact can include abandoned purchases, lower retention, lost revenue, development rework, and accessibility-related costs. The article's data shows that these losses can accumulate across the entire customer journey.
Which UX metrics should product teams track?
Product teams should track metrics that connect user behavior with business outcomes. Core metrics can include conversion rate, task completion rate, abandonment rate, retention, time on task, error rate, Core Web Vitals, and accessibility compliance. The right metrics depend on the product's goals and should be measured before and after UX changes.
How does page speed affect UX and conversions?
Page speed directly influences whether users stay on a page and complete an action. For instance, Google research cited in the article found that 53% of mobile users abandon pages that take more than three seconds to load.
When should a digital product be redesigned?
A redesign is worth considering when usability problems consistently affect business or user metrics, the product no longer meets user expectations, the interface has accumulated significant UX debt, or its technology and business model have changed. A redesign should be driven by research and measurable problems rather than aesthetics alone.
Read more
 advantage
 Book a call
Fill out the form
or brief with questions



 LinkedIn
 Instagram
Welcome to Goodface privacy notice.
Goodface respects your privacy and is committed to protecting your personal data. This privacy notice will inform you as to how we look after your personal data when you visit our website (regardless of where you visit it from) and other sites we own and operate. And tell you about your privacy rights and how the law protects you.
We may change the privacy policy from time to time to reflect changes to the products and services that we provide and how we process your personal data.
We will not share your information with any third party outside of our organization, other than as necessary to fulfil your request if any."
INFORMATION WE COLLECTWhen you visit our website, our servers may automatically log the standard data provided by your web browser. This data is considered “non-identifying information”, as it does not personally identify you on its own. It may include:
- Your computer’s Internet Protocol (IP) address;
- Your browser type and version;
- The pages you visit;
- The time and date of your visi;
- The time spent on each page;
We may ask for personal information, such as your name and email address. This data is considered “identifying information”, as it can personally identify you. We only request personal information relevant to providing you with a service, and only use it to help provide or improve this service.
We collect information by fair and lawful means, with your knowledge and consent. We also let you know why we’re collecting it and how it will be used. You are free to refuse our request for this information, with the understanding that we may be unable to provide you with some of your desired services without it.
We will only process personal data and communicate with you if:
1. You have given us consent to the processing of your personal data and communicating for one or more specific purposes i.e. requesting products or services from us, downloading material or information from our website or submitting a contact us form.
2. Performance of a contract
3. Where we have a legitimate interest for contacting you in relation to our products and services
DATA PROCESSING AND STORAGEWe only retain personal information for as long as necessary to provide a service, or to improve our services in future. While we retain this data, we will protect it within commercially acceptable means to prevent loss and theft, as well as unauthorised access, disclosure, copying, use or modification. That said, we advise that no method of electronic transmission or storage is 100% secure, and cannot guarantee absolute data security.
Rights and choices of individuals:
- See what data we have about you, if any;
- Change/correct any data we have about you;
- Have us delete any data we have about you;
- See what security measures we apply to your data;
- Express any concern you have about our use of your data;
You may opt out of any future contacts from us at any time. You can do the following at any time by contacting us via the email address given on our website: goodface.agency
Got questions or want to discuss a project?


